Immigrants from France vs Guatemalan Unemployment Among Ages 20 to 24 years
COMPARE
Immigrants from France
Guatemalan
Unemployment Among Ages 20 to 24 years
Unemployment Among Ages 20 to 24 years Comparison
Immigrants from France
Guatemalans
10.0%
UNEMPLOYMENT AMONG AGES 20 TO 24 YEARS
95.2/ 100
METRIC RATING
100th/ 347
METRIC RANK
10.5%
UNEMPLOYMENT AMONG AGES 20 TO 24 YEARS
12.2/ 100
METRIC RATING
213th/ 347
METRIC RANK
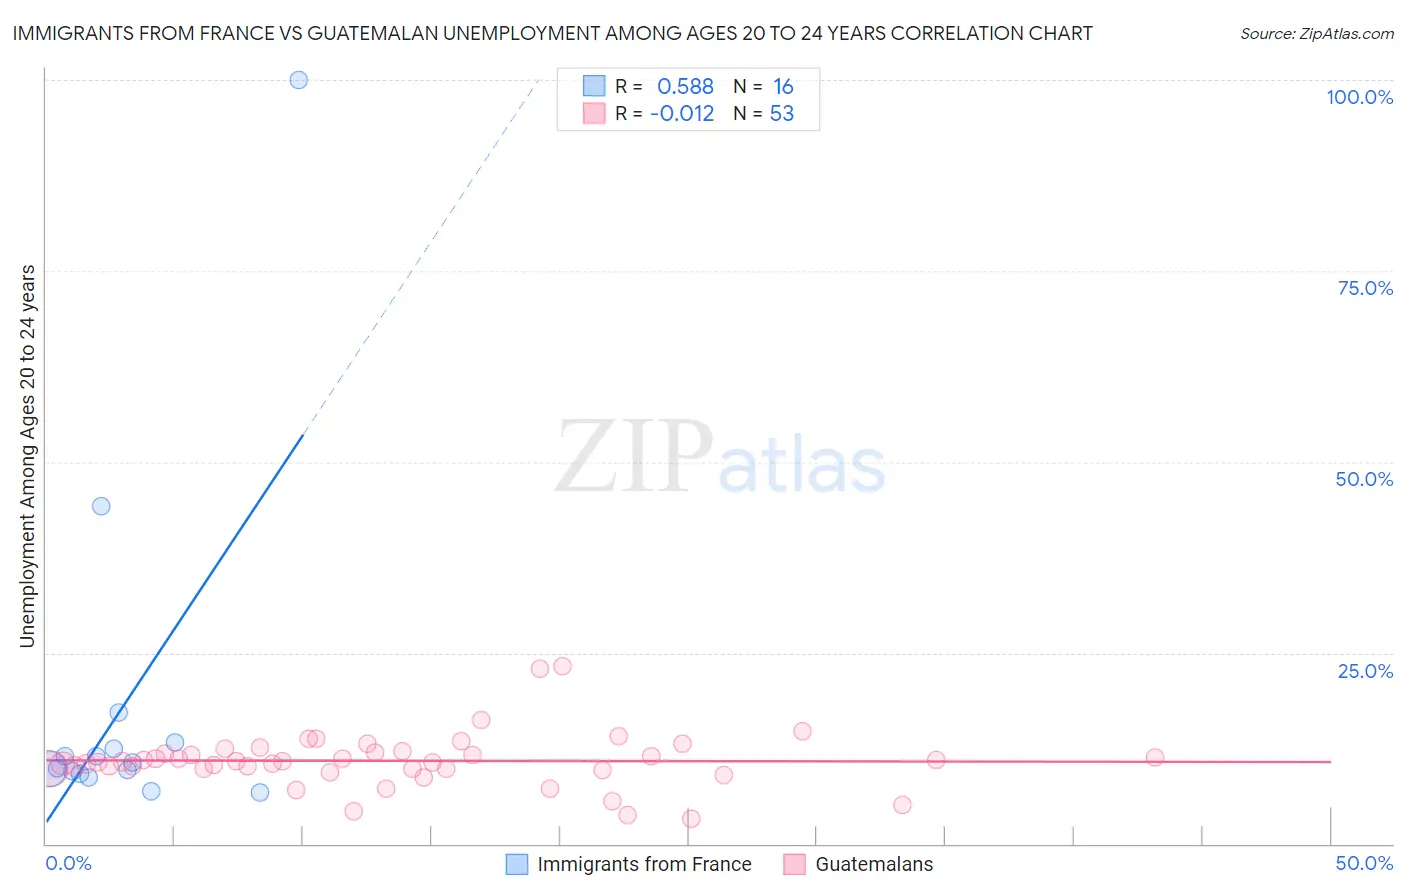
Immigrants from France vs Guatemalan Unemployment Among Ages 20 to 24 years Correlation Chart
The statistical analysis conducted on geographies consisting of 281,767,026 people shows a substantial positive correlation between the proportion of Immigrants from France and unemployment rate among population between the ages 20 and 24 in the United States with a correlation coefficient (R) of 0.588 and weighted average of 10.0%. Similarly, the statistical analysis conducted on geographies consisting of 397,999,155 people shows no correlation between the proportion of Guatemalans and unemployment rate among population between the ages 20 and 24 in the United States with a correlation coefficient (R) of -0.012 and weighted average of 10.5%, a difference of 4.7%.
Unemployment Among Ages 20 to 24 years Correlation Summary
| Measurement | Immigrants from France | Guatemalan |
| Minimum | 6.7% | 3.2% |
| Maximum | 100.0% | 23.2% |
| Range | 93.3% | 20.0% |
| Mean | 18.2% | 10.9% |
| Median | 10.3% | 10.7% |
| Interquartile 25% (IQ1) | 9.3% | 9.8% |
| Interquartile 75% (IQ3) | 12.9% | 12.0% |
| Interquartile Range (IQR) | 3.6% | 2.2% |
| Standard Deviation (Sample) | 23.5% | 3.6% |
| Standard Deviation (Population) | 22.8% | 3.5% |
Similar Demographics by Unemployment Among Ages 20 to 24 years
Demographics Similar to Immigrants from France by Unemployment Among Ages 20 to 24 years
In terms of unemployment among ages 20 to 24 years, the demographic groups most similar to Immigrants from France are Fijian (10.0%, a difference of 0.010%), Japanese (10.0%, a difference of 0.030%), Laotian (10.0%, a difference of 0.030%), Immigrants from Argentina (10.0%, a difference of 0.080%), and Slavic (10.0%, a difference of 0.18%).
| Demographics | Rating | Rank | Unemployment Among Ages 20 to 24 years |
| Immigrants | Malaysia | 96.9 /100 | #93 | Exceptional 10.0% |
| Immigrants | Micronesia | 96.6 /100 | #94 | Exceptional 10.0% |
| Scotch-Irish | 96.2 /100 | #95 | Exceptional 10.0% |
| Thais | 96.2 /100 | #96 | Exceptional 10.0% |
| Slavs | 96.1 /100 | #97 | Exceptional 10.0% |
| Japanese | 95.4 /100 | #98 | Exceptional 10.0% |
| Fijians | 95.3 /100 | #99 | Exceptional 10.0% |
| Immigrants | France | 95.2 /100 | #100 | Exceptional 10.0% |
| Laotians | 95.1 /100 | #101 | Exceptional 10.0% |
| Immigrants | Argentina | 94.9 /100 | #102 | Exceptional 10.0% |
| Irish | 94.3 /100 | #103 | Exceptional 10.0% |
| Immigrants | Chile | 94.0 /100 | #104 | Exceptional 10.0% |
| Immigrants | Hungary | 94.0 /100 | #105 | Exceptional 10.0% |
| Pennsylvania Germans | 93.9 /100 | #106 | Exceptional 10.0% |
| Iroquois | 93.4 /100 | #107 | Exceptional 10.1% |
Demographics Similar to Guatemalans by Unemployment Among Ages 20 to 24 years
In terms of unemployment among ages 20 to 24 years, the demographic groups most similar to Guatemalans are Kiowa (10.5%, a difference of 0.040%), Immigrants from Sri Lanka (10.5%, a difference of 0.14%), Honduran (10.5%, a difference of 0.15%), Immigrants from Guatemala (10.5%, a difference of 0.19%), and Costa Rican (10.5%, a difference of 0.24%).
| Demographics | Rating | Rank | Unemployment Among Ages 20 to 24 years |
| Immigrants | Europe | 18.5 /100 | #206 | Poor 10.4% |
| Immigrants | Honduras | 17.9 /100 | #207 | Poor 10.4% |
| Immigrants | Hong Kong | 17.6 /100 | #208 | Poor 10.5% |
| Peruvians | 17.2 /100 | #209 | Poor 10.5% |
| Immigrants | Belgium | 16.9 /100 | #210 | Poor 10.5% |
| Immigrants | Guatemala | 14.6 /100 | #211 | Poor 10.5% |
| Immigrants | Sri Lanka | 14.0 /100 | #212 | Poor 10.5% |
| Guatemalans | 12.2 /100 | #213 | Poor 10.5% |
| Kiowa | 11.7 /100 | #214 | Poor 10.5% |
| Hondurans | 10.5 /100 | #215 | Poor 10.5% |
| Costa Ricans | 9.6 /100 | #216 | Tragic 10.5% |
| Cherokee | 9.3 /100 | #217 | Tragic 10.5% |
| Immigrants | Nonimmigrants | 8.8 /100 | #218 | Tragic 10.5% |
| Immigrants | Southern Europe | 8.0 /100 | #219 | Tragic 10.5% |
| Eastern Europeans | 6.9 /100 | #220 | Tragic 10.6% |