Immigrants from Belgium vs Bahamian Unemployment Among Ages 25 to 29 years
COMPARE
Immigrants from Belgium
Bahamian
Unemployment Among Ages 25 to 29 years
Unemployment Among Ages 25 to 29 years Comparison
Immigrants from Belgium
Bahamians
6.5%
UNEMPLOYMENT AMONG AGES 25 TO 29 YEARS
73.8/ 100
METRIC RATING
138th/ 347
METRIC RANK
7.5%
UNEMPLOYMENT AMONG AGES 25 TO 29 YEARS
0.0/ 100
METRIC RATING
270th/ 347
METRIC RANK
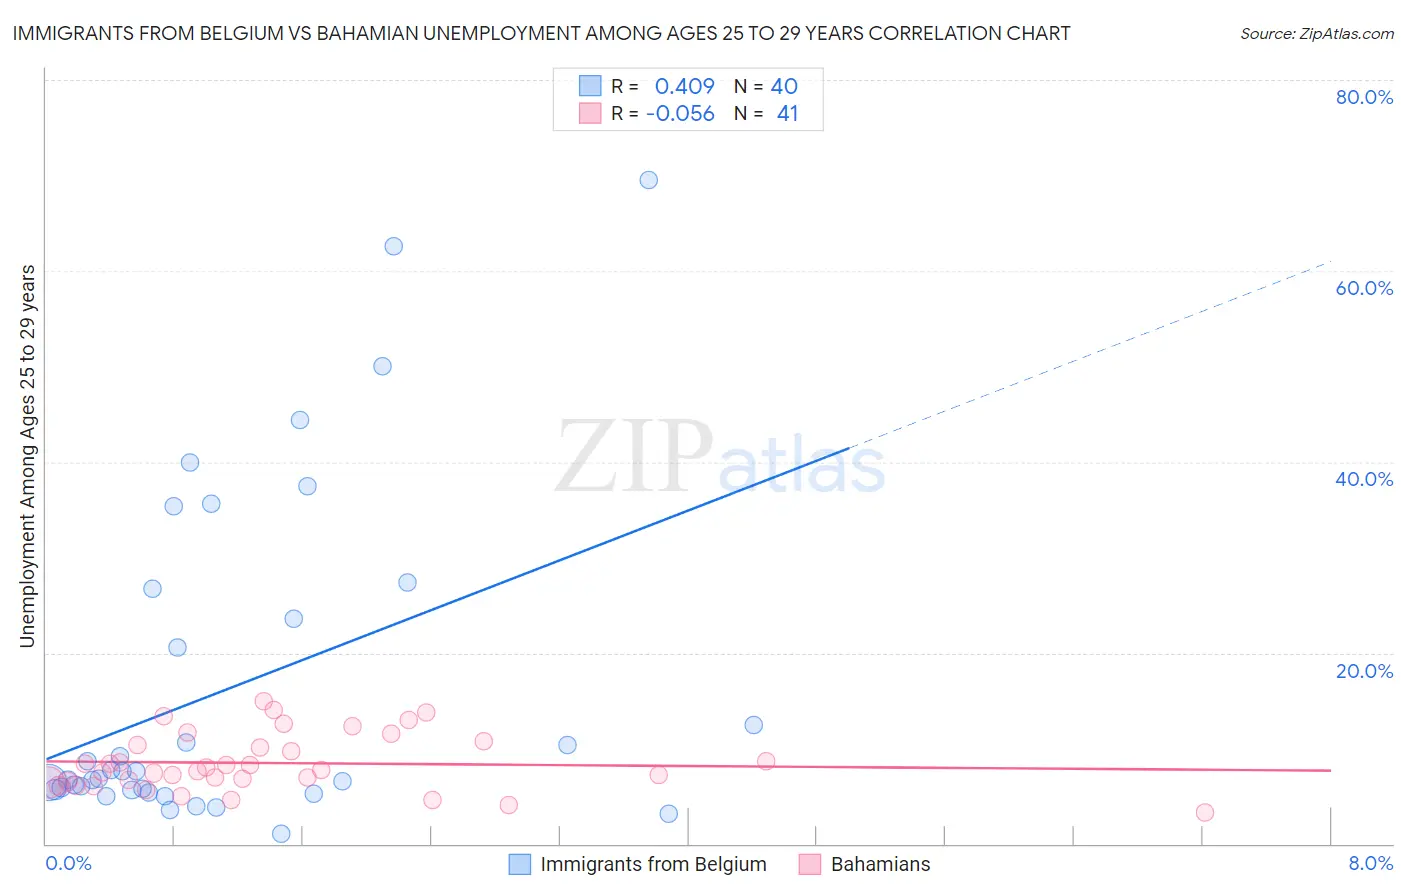
Immigrants from Belgium vs Bahamian Unemployment Among Ages 25 to 29 years Correlation Chart
The statistical analysis conducted on geographies consisting of 142,874,204 people shows a moderate positive correlation between the proportion of Immigrants from Belgium and unemployment rate among population between the ages 25 and 29 in the United States with a correlation coefficient (R) of 0.409 and weighted average of 6.5%. Similarly, the statistical analysis conducted on geographies consisting of 110,749,635 people shows a slight negative correlation between the proportion of Bahamians and unemployment rate among population between the ages 25 and 29 in the United States with a correlation coefficient (R) of -0.056 and weighted average of 7.5%, a difference of 14.0%.
Unemployment Among Ages 25 to 29 years Correlation Summary
| Measurement | Immigrants from Belgium | Bahamian |
| Minimum | 1.1% | 3.3% |
| Maximum | 69.5% | 15.0% |
| Range | 68.4% | 11.7% |
| Mean | 16.3% | 8.5% |
| Median | 7.2% | 7.7% |
| Interquartile 25% (IQ1) | 5.7% | 6.5% |
| Interquartile 75% (IQ3) | 25.1% | 10.6% |
| Interquartile Range (IQR) | 19.4% | 4.1% |
| Standard Deviation (Sample) | 17.4% | 2.9% |
| Standard Deviation (Population) | 17.2% | 2.9% |
Similar Demographics by Unemployment Among Ages 25 to 29 years
Demographics Similar to Immigrants from Belgium by Unemployment Among Ages 25 to 29 years
In terms of unemployment among ages 25 to 29 years, the demographic groups most similar to Immigrants from Belgium are Austrian (6.5%, a difference of 0.0%), Immigrants from Pakistan (6.5%, a difference of 0.0%), Eastern European (6.5%, a difference of 0.020%), Maltese (6.5%, a difference of 0.070%), and Slavic (6.5%, a difference of 0.10%).
| Demographics | Rating | Rank | Unemployment Among Ages 25 to 29 years |
| Immigrants | Afghanistan | 79.2 /100 | #131 | Good 6.5% |
| Poles | 76.6 /100 | #132 | Good 6.5% |
| Immigrants | Europe | 75.7 /100 | #133 | Good 6.5% |
| Immigrants | Vietnam | 75.6 /100 | #134 | Good 6.5% |
| Immigrants | Croatia | 75.5 /100 | #135 | Good 6.5% |
| Northern Europeans | 75.4 /100 | #136 | Good 6.5% |
| Eastern Europeans | 74.1 /100 | #137 | Good 6.5% |
| Immigrants | Belgium | 73.8 /100 | #138 | Good 6.5% |
| Austrians | 73.8 /100 | #139 | Good 6.5% |
| Immigrants | Pakistan | 73.8 /100 | #140 | Good 6.5% |
| Maltese | 72.9 /100 | #141 | Good 6.5% |
| Slavs | 72.5 /100 | #142 | Good 6.5% |
| Lithuanians | 72.2 /100 | #143 | Good 6.5% |
| Immigrants | Micronesia | 71.5 /100 | #144 | Good 6.6% |
| Nicaraguans | 70.2 /100 | #145 | Good 6.6% |
Demographics Similar to Bahamians by Unemployment Among Ages 25 to 29 years
In terms of unemployment among ages 25 to 29 years, the demographic groups most similar to Bahamians are Choctaw (7.5%, a difference of 0.020%), Immigrants from Bahamas (7.5%, a difference of 0.080%), Immigrants from Nigeria (7.5%, a difference of 0.10%), Immigrants from Central America (7.5%, a difference of 0.31%), and Immigrants from Ghana (7.5%, a difference of 0.39%).
| Demographics | Rating | Rank | Unemployment Among Ages 25 to 29 years |
| Kiowa | 0.1 /100 | #263 | Tragic 7.4% |
| Immigrants | Western Africa | 0.1 /100 | #264 | Tragic 7.4% |
| Immigrants | Fiji | 0.1 /100 | #265 | Tragic 7.4% |
| Paiute | 0.1 /100 | #266 | Tragic 7.4% |
| Pennsylvania Germans | 0.1 /100 | #267 | Tragic 7.4% |
| Immigrants | Ecuador | 0.1 /100 | #268 | Tragic 7.4% |
| Immigrants | Latin America | 0.1 /100 | #269 | Tragic 7.4% |
| Bahamians | 0.0 /100 | #270 | Tragic 7.5% |
| Choctaw | 0.0 /100 | #271 | Tragic 7.5% |
| Immigrants | Bahamas | 0.0 /100 | #272 | Tragic 7.5% |
| Immigrants | Nigeria | 0.0 /100 | #273 | Tragic 7.5% |
| Immigrants | Central America | 0.0 /100 | #274 | Tragic 7.5% |
| Immigrants | Ghana | 0.0 /100 | #275 | Tragic 7.5% |
| French American Indians | 0.0 /100 | #276 | Tragic 7.5% |
| Iroquois | 0.0 /100 | #277 | Tragic 7.5% |