Argentinean vs Nicaraguan Unemployment Among Women with Children Ages 6 to 17 years
COMPARE
Argentinean
Nicaraguan
Unemployment Among Women with Children Ages 6 to 17 years
Unemployment Among Women with Children Ages 6 to 17 years Comparison
Argentineans
Nicaraguans
8.6%
UNEMPLOYMENT AMONG WOMEN WITH CHILDREN AGES 6 TO 17 YEARS
96.5/ 100
METRIC RATING
115th/ 347
METRIC RANK
9.4%
UNEMPLOYMENT AMONG WOMEN WITH CHILDREN AGES 6 TO 17 YEARS
1.0/ 100
METRIC RATING
254th/ 347
METRIC RANK
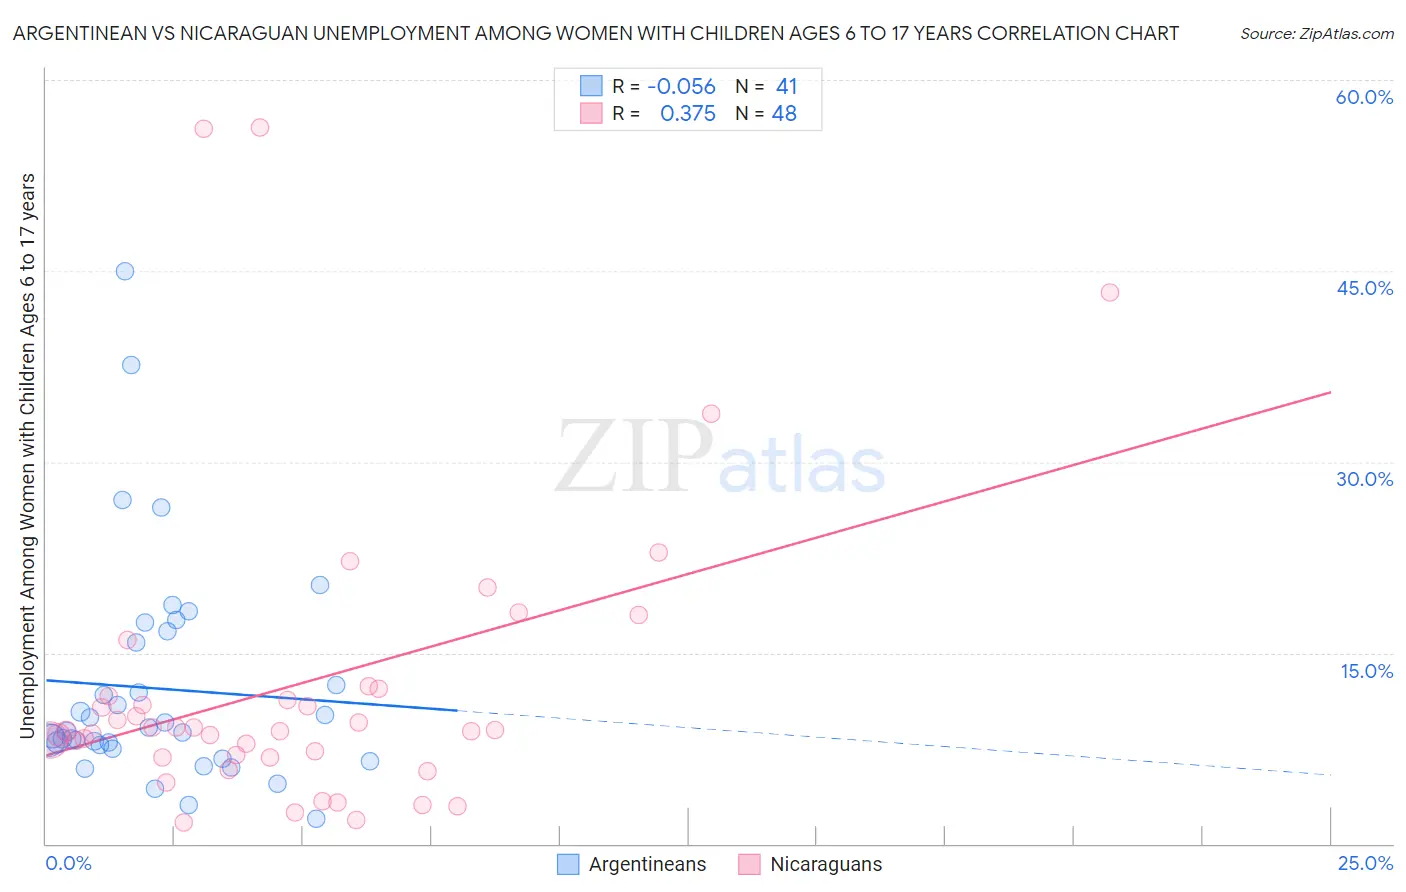
Argentinean vs Nicaraguan Unemployment Among Women with Children Ages 6 to 17 years Correlation Chart
The statistical analysis conducted on geographies consisting of 227,377,871 people shows a slight negative correlation between the proportion of Argentineans and unemployment rate among women with children between the ages 6 and 17 in the United States with a correlation coefficient (R) of -0.056 and weighted average of 8.6%. Similarly, the statistical analysis conducted on geographies consisting of 225,411,193 people shows a mild positive correlation between the proportion of Nicaraguans and unemployment rate among women with children between the ages 6 and 17 in the United States with a correlation coefficient (R) of 0.375 and weighted average of 9.4%, a difference of 9.2%.
Unemployment Among Women with Children Ages 6 to 17 years Correlation Summary
| Measurement | Argentinean | Nicaraguan |
| Minimum | 2.0% | 1.6% |
| Maximum | 45.0% | 56.3% |
| Range | 43.0% | 54.7% |
| Mean | 12.2% | 12.5% |
| Median | 8.8% | 8.9% |
| Interquartile 25% (IQ1) | 7.6% | 6.9% |
| Interquartile 75% (IQ3) | 16.3% | 11.9% |
| Interquartile Range (IQR) | 8.6% | 5.0% |
| Standard Deviation (Sample) | 8.8% | 12.0% |
| Standard Deviation (Population) | 8.7% | 11.9% |
Similar Demographics by Unemployment Among Women with Children Ages 6 to 17 years
Demographics Similar to Argentineans by Unemployment Among Women with Children Ages 6 to 17 years
In terms of unemployment among women with children ages 6 to 17 years, the demographic groups most similar to Argentineans are Immigrants from Russia (8.6%, a difference of 0.070%), Zimbabwean (8.6%, a difference of 0.070%), Eastern European (8.6%, a difference of 0.080%), Albanian (8.6%, a difference of 0.080%), and Pueblo (8.6%, a difference of 0.11%).
| Demographics | Rating | Rank | Unemployment Among Women with Children Ages 6 to 17 years |
| Swedes | 97.6 /100 | #108 | Exceptional 8.6% |
| Immigrants | Romania | 97.5 /100 | #109 | Exceptional 8.6% |
| Latvians | 97.4 /100 | #110 | Exceptional 8.6% |
| Immigrants | Ukraine | 97.4 /100 | #111 | Exceptional 8.6% |
| Romanians | 97.1 /100 | #112 | Exceptional 8.6% |
| Eastern Europeans | 96.8 /100 | #113 | Exceptional 8.6% |
| Immigrants | Russia | 96.7 /100 | #114 | Exceptional 8.6% |
| Argentineans | 96.5 /100 | #115 | Exceptional 8.6% |
| Zimbabweans | 96.3 /100 | #116 | Exceptional 8.6% |
| Albanians | 96.3 /100 | #117 | Exceptional 8.6% |
| Pueblo | 96.2 /100 | #118 | Exceptional 8.6% |
| Immigrants | Grenada | 96.2 /100 | #119 | Exceptional 8.6% |
| Israelis | 95.9 /100 | #120 | Exceptional 8.7% |
| Immigrants | Denmark | 95.5 /100 | #121 | Exceptional 8.7% |
| Immigrants | Egypt | 95.0 /100 | #122 | Exceptional 8.7% |
Demographics Similar to Nicaraguans by Unemployment Among Women with Children Ages 6 to 17 years
In terms of unemployment among women with children ages 6 to 17 years, the demographic groups most similar to Nicaraguans are Lithuanian (9.4%, a difference of 0.060%), Portuguese (9.4%, a difference of 0.17%), Canadian (9.4%, a difference of 0.23%), Creek (9.4%, a difference of 0.26%), and Celtic (9.5%, a difference of 0.26%).
| Demographics | Rating | Rank | Unemployment Among Women with Children Ages 6 to 17 years |
| Poles | 1.5 /100 | #247 | Tragic 9.4% |
| Dutch | 1.5 /100 | #248 | Tragic 9.4% |
| Immigrants | South America | 1.5 /100 | #249 | Tragic 9.4% |
| Immigrants | Guatemala | 1.3 /100 | #250 | Tragic 9.4% |
| Central Americans | 1.3 /100 | #251 | Tragic 9.4% |
| Creek | 1.2 /100 | #252 | Tragic 9.4% |
| Portuguese | 1.1 /100 | #253 | Tragic 9.4% |
| Nicaraguans | 1.0 /100 | #254 | Tragic 9.4% |
| Lithuanians | 0.9 /100 | #255 | Tragic 9.4% |
| Canadians | 0.8 /100 | #256 | Tragic 9.4% |
| Celtics | 0.7 /100 | #257 | Tragic 9.5% |
| Immigrants | Mexico | 0.7 /100 | #258 | Tragic 9.5% |
| Immigrants | Central America | 0.6 /100 | #259 | Tragic 9.5% |
| Italians | 0.6 /100 | #260 | Tragic 9.5% |
| South Americans | 0.5 /100 | #261 | Tragic 9.5% |