Arab vs Immigrants from Sierra Leone Unemployment Among Ages 45 to 54 years
COMPARE
Arab
Immigrants from Sierra Leone
Unemployment Among Ages 45 to 54 years
Unemployment Among Ages 45 to 54 years Comparison
Arabs
Immigrants from Sierra Leone
4.6%
UNEMPLOYMENT AMONG AGES 45 TO 54 YEARS
13.7/ 100
METRIC RATING
207th/ 347
METRIC RANK
4.6%
UNEMPLOYMENT AMONG AGES 45 TO 54 YEARS
36.3/ 100
METRIC RATING
188th/ 347
METRIC RANK
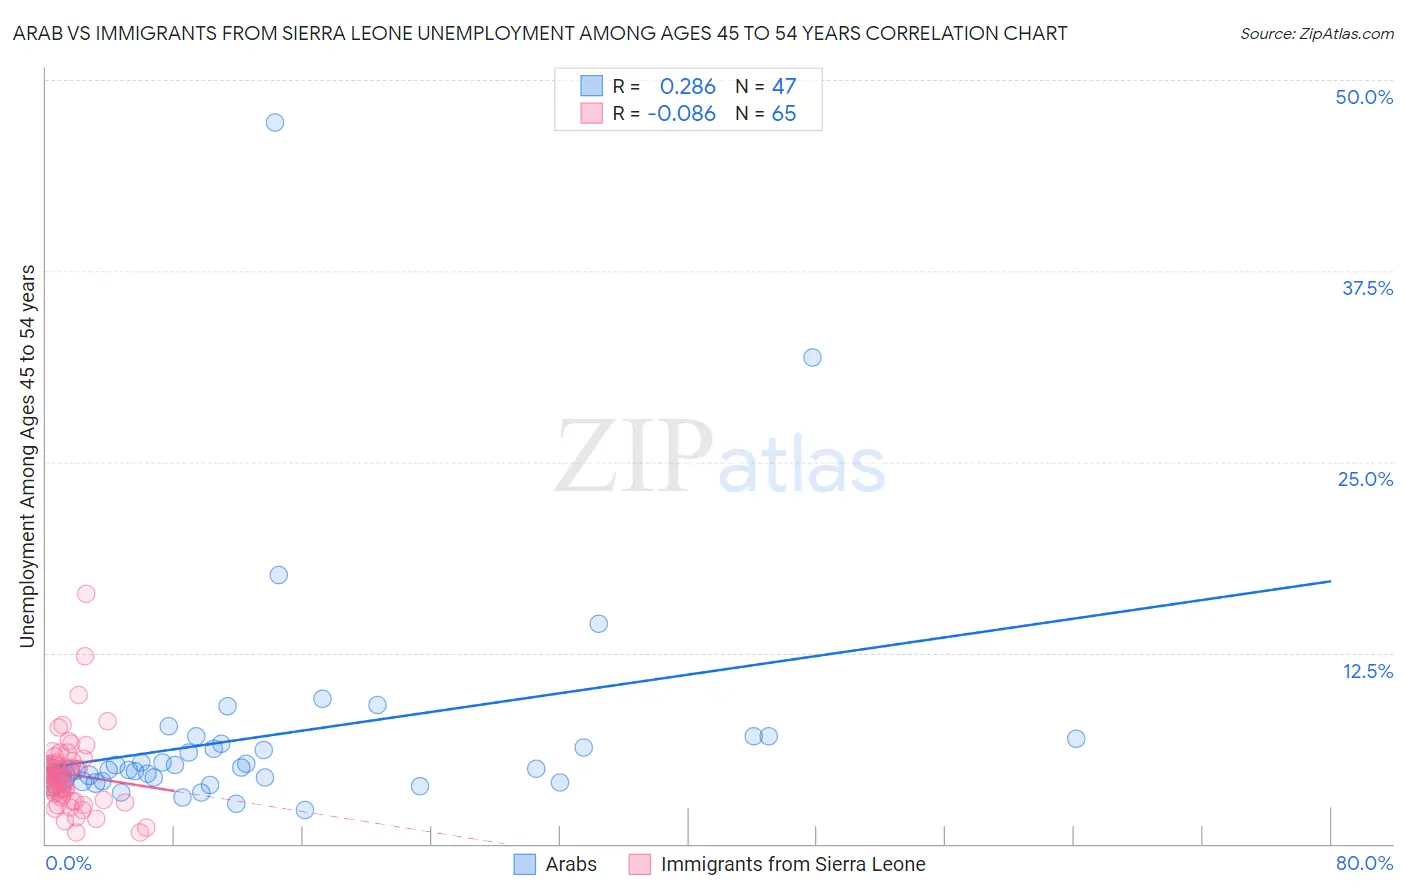
Arab vs Immigrants from Sierra Leone Unemployment Among Ages 45 to 54 years Correlation Chart
The statistical analysis conducted on geographies consisting of 468,693,746 people shows a weak positive correlation between the proportion of Arabs and unemployment rate among population between the ages 45 and 54 in the United States with a correlation coefficient (R) of 0.286 and weighted average of 4.6%. Similarly, the statistical analysis conducted on geographies consisting of 100,959,310 people shows a slight negative correlation between the proportion of Immigrants from Sierra Leone and unemployment rate among population between the ages 45 and 54 in the United States with a correlation coefficient (R) of -0.086 and weighted average of 4.6%, a difference of 1.5%.
Unemployment Among Ages 45 to 54 years Correlation Summary
| Measurement | Arab | Immigrants from Sierra Leone |
| Minimum | 2.2% | 0.70% |
| Maximum | 47.2% | 16.4% |
| Range | 45.0% | 15.7% |
| Mean | 7.1% | 4.6% |
| Median | 4.9% | 4.4% |
| Interquartile 25% (IQ1) | 4.3% | 3.1% |
| Interquartile 75% (IQ3) | 6.9% | 5.3% |
| Interquartile Range (IQR) | 2.6% | 2.2% |
| Standard Deviation (Sample) | 7.6% | 2.5% |
| Standard Deviation (Population) | 7.5% | 2.5% |
Demographics Similar to Arabs and Immigrants from Sierra Leone by Unemployment Among Ages 45 to 54 years
In terms of unemployment among ages 45 to 54 years, the demographic groups most similar to Arabs are Immigrants from Switzerland (4.6%, a difference of 0.030%), Immigrants from Greece (4.6%, a difference of 0.23%), Immigrants from Morocco (4.6%, a difference of 0.27%), Liberian (4.6%, a difference of 0.42%), and Immigrants from Peru (4.6%, a difference of 0.45%). Similarly, the demographic groups most similar to Immigrants from Sierra Leone are Immigrants from Ukraine (4.5%, a difference of 0.030%), Immigrants from Laos (4.6%, a difference of 0.030%), Immigrants from Serbia (4.6%, a difference of 0.080%), Immigrants from Uruguay (4.6%, a difference of 0.10%), and Immigrants from Thailand (4.6%, a difference of 0.11%).
| Demographics | Rating | Rank | Unemployment Among Ages 45 to 54 years |
| Immigrants | Ukraine | 36.8 /100 | #187 | Fair 4.5% |
| Immigrants | Sierra Leone | 36.3 /100 | #188 | Fair 4.6% |
| Immigrants | Laos | 35.7 /100 | #189 | Fair 4.6% |
| Immigrants | Serbia | 34.8 /100 | #190 | Fair 4.6% |
| Immigrants | Uruguay | 34.4 /100 | #191 | Fair 4.6% |
| Immigrants | Thailand | 34.1 /100 | #192 | Fair 4.6% |
| Immigrants | Lithuania | 33.2 /100 | #193 | Fair 4.6% |
| South Americans | 32.9 /100 | #194 | Fair 4.6% |
| Peruvians | 31.5 /100 | #195 | Fair 4.6% |
| Estonians | 31.2 /100 | #196 | Fair 4.6% |
| Albanians | 31.1 /100 | #197 | Fair 4.6% |
| Immigrants | Belarus | 30.6 /100 | #198 | Fair 4.6% |
| Brazilians | 20.1 /100 | #199 | Fair 4.6% |
| Immigrants | Denmark | 19.8 /100 | #200 | Poor 4.6% |
| Immigrants | Costa Rica | 19.7 /100 | #201 | Poor 4.6% |
| Immigrants | Peru | 19.1 /100 | #202 | Poor 4.6% |
| Liberians | 18.7 /100 | #203 | Poor 4.6% |
| Immigrants | Morocco | 16.8 /100 | #204 | Poor 4.6% |
| Immigrants | Greece | 16.2 /100 | #205 | Poor 4.6% |
| Immigrants | Switzerland | 14.0 /100 | #206 | Poor 4.6% |
| Arabs | 13.7 /100 | #207 | Poor 4.6% |