Arab vs Immigrants from Argentina Unemployment Among Women with Children Ages 6 to 17 years

COMPARE

Arab
Race
Ancestry
AfghanAfricanAlaska NativeAlaskan AthabascanAlbanianAleutAlsatianAmericanApacheArabArapahoArgentineanArmenianAssyrian/Chaldean/SyriacAustralianAustrianBahamianBangladeshiBarbadianBasqueBelgianBelizeanBermudanBhutaneseBlackfeetBolivianBrazilianBritishBritish West IndianBulgarianBurmeseCajunCambodianCanadianCape VerdeanCarpatho RusynCelticCentral AmericanCentral American IndianCherokeeCheyenneChickasawChileanChineseChippewaChoctawColombianColvilleComancheCosta RicanCreeCreekCroatianCrowCubanCypriotCzechCzechoslovakianDanishDelawareDominicanDutchDutch West IndianEastern EuropeanEcuadorianEgyptianEnglishEstonianEthiopianEuropeanFijianFilipinoFinnishFrenchFrench American IndianFrench CanadianGermanGerman RussianGhanaianGreekGuamanian/ChamorroGuatemalanGuyaneseHaitianHmongHonduranHopiHoumaHungarianIcelanderIndian (Asian)IndonesianInupiatIranianIraqiIrishIroquoisIsraeliItalianJamaicanJapaneseJordanianKenyanKiowaKoreanLaotianLatvianLebaneseLiberianLithuanianLumbeeLuxembourgerMacedonianMalaysianMalteseMarshalleseMenomineeMexicanMexican American IndianMongolianMoroccanNative HawaiianNavajoNepaleseNew ZealanderNicaraguanNigerianNorthern EuropeanNorwegianOkinawanOsageOttawaPaiutePakistaniPalestinianPanamanianParaguayanPennsylvania GermanPeruvianPimaPolishPortuguesePotawatomiPuebloPuerto RicanPuget Sound SalishRomanianRussianSalvadoranSamoanScandinavianScotch-IrishScottishSeminoleSenegaleseSerbianShoshoneSierra LeoneanSiouxSlavicSlovakSloveneSomaliSouth AfricanSouth AmericanSouth American IndianSoviet UnionSpaniardSpanishSpanish AmericanSpanish American IndianSri LankanSubsaharan AfricanSudaneseSwedishSwissSyrianTaiwaneseThaiTlingit-HaidaTohono O'OdhamTonganTrinidadian and TobagonianTsimshianTurkishU.S. Virgin IslanderUgandanUkrainianUruguayanUteVenezuelanVietnameseWelshWest IndianYakamaYaquiYugoslavianYumanYup'ikZimbabwean
Immigration
NonimmigrantsImmigrantsAfghanistanAfricaAlbaniaArmeniaAsiaAustraliaAustriaBahamasBangladeshBarbadosBelarusBelgiumBelizeBoliviaBosnia and HerzegovinaBrazilBulgariaBurma/MyanmarCabo VerdeCambodiaCameroonCanadaCaribbeanCentral AmericaChileChinaColombiaCongoCosta RicaCroatiaCubaCzechoslovakiaDenmarkDominicaDominican RepublicEastern AfricaEastern AsiaEastern EuropeEcuadorEgyptEl SalvadorEnglandEritreaEthiopiaEuropeFijiFranceGermanyGhanaGreeceGrenadaGuatemalaGuyanaHaitiHondurasHong KongHungaryIndiaIndonesiaIranIraqIrelandIsraelItalyJamaicaJapanJordanKazakhstanKenyaKoreaKuwaitLaosLatin AmericaLatviaLebanonLiberiaLithuaniaMalaysiaMexicoMicronesiaMiddle AfricaMoldovaMoroccoNepalNetherlandsNicaraguaNigeriaNorth AmericaNorth MacedoniaNorthern AfricaNorthern EuropeNorwayOceaniaPakistanPanamaPeruPhilippinesPolandPortugalRomaniaRussiaSaudi ArabiaScotlandSenegalSerbiaSierra LeoneSingaporeSomaliaSouth AfricaSouth AmericaSouth Central AsiaSouth Eastern AsiaSouthern EuropeSpainSri LankaSt. Vincent and the GrenadinesSudanSwedenSwitzerlandSyriaTaiwanThailandTrinidad and TobagoTurkeyUgandaUkraineUruguayUzbekistanVenezuelaVietnamWest IndiesWestern AfricaWestern AsiaWestern EuropeYemenZaireZimbabweAzores
Immigrants from Argentina
Race
Ancestry
AfghanAfricanAlaska NativeAlaskan AthabascanAlbanianAleutAlsatianAmericanApacheArapahoArgentineanArmenianAssyrian/Chaldean/SyriacAustralianAustrianBahamianBangladeshiBarbadianBasqueBelgianBelizeanBermudanBhutaneseBlackfeetBolivianBrazilianBritishBritish West IndianBulgarianBurmeseCajunCambodianCanadianCape VerdeanCarpatho RusynCelticCentral AmericanCentral American IndianCherokeeCheyenneChickasawChileanChineseChippewaChoctawColombianColvilleComancheCosta RicanCreeCreekCroatianCrowCubanCypriotCzechCzechoslovakianDanishDelawareDominicanDutchDutch West IndianEastern EuropeanEcuadorianEgyptianEnglishEstonianEthiopianEuropeanFijianFilipinoFinnishFrenchFrench American IndianFrench CanadianGermanGerman RussianGhanaianGreekGuamanian/ChamorroGuatemalanGuyaneseHaitianHmongHonduranHopiHoumaHungarianIcelanderIndian (Asian)IndonesianInupiatIranianIraqiIrishIroquoisIsraeliItalianJamaicanJapaneseJordanianKenyanKiowaKoreanLaotianLatvianLebaneseLiberianLithuanianLumbeeLuxembourgerMacedonianMalaysianMalteseMarshalleseMenomineeMexicanMexican American IndianMongolianMoroccanNative HawaiianNavajoNepaleseNew ZealanderNicaraguanNigerianNorthern EuropeanNorwegianOkinawanOsageOttawaPaiutePakistaniPalestinianPanamanianParaguayanPennsylvania GermanPeruvianPimaPolishPortuguesePotawatomiPuebloPuerto RicanPuget Sound SalishRomanianRussianSalvadoranSamoanScandinavianScotch-IrishScottishSeminoleSenegaleseSerbianShoshoneSierra LeoneanSiouxSlavicSlovakSloveneSomaliSouth AfricanSouth AmericanSouth American IndianSoviet UnionSpaniardSpanishSpanish AmericanSpanish American IndianSri LankanSubsaharan AfricanSudaneseSwedishSwissSyrianTaiwaneseThaiTlingit-HaidaTohono O'OdhamTonganTrinidadian and TobagonianTsimshianTurkishU.S. Virgin IslanderUgandanUkrainianUruguayanUteVenezuelanVietnameseWelshWest IndianYakamaYaquiYugoslavianYumanYup'ikZimbabwean
Immigration
NonimmigrantsImmigrantsAfghanistanAfricaAlbaniaArgentinaArmeniaAsiaAustraliaAustriaBahamasBangladeshBarbadosBelarusBelgiumBelizeBoliviaBosnia and HerzegovinaBrazilBulgariaBurma/MyanmarCabo VerdeCambodiaCameroonCanadaCaribbeanCentral AmericaChileChinaColombiaCongoCosta RicaCroatiaCubaCzechoslovakiaDenmarkDominicaDominican RepublicEastern AfricaEastern AsiaEastern EuropeEcuadorEgyptEl SalvadorEnglandEritreaEthiopiaEuropeFijiFranceGermanyGhanaGreeceGrenadaGuatemalaGuyanaHaitiHondurasHong KongHungaryIndiaIndonesiaIranIraqIrelandIsraelItalyJamaicaJapanJordanKazakhstanKenyaKoreaKuwaitLaosLatin AmericaLatviaLebanonLiberiaLithuaniaMalaysiaMexicoMicronesiaMiddle AfricaMoldovaMoroccoNepalNetherlandsNicaraguaNigeriaNorth AmericaNorth MacedoniaNorthern AfricaNorthern EuropeNorwayOceaniaPakistanPanamaPeruPhilippinesPolandPortugalRomaniaRussiaSaudi ArabiaScotlandSenegalSerbiaSierra LeoneSingaporeSomaliaSouth AfricaSouth AmericaSouth Central AsiaSouth Eastern AsiaSouthern EuropeSpainSri LankaSt. Vincent and the GrenadinesSudanSwedenSwitzerlandSyriaTaiwanThailandTrinidad and TobagoTurkeyUgandaUkraineUruguayUzbekistanVenezuelaVietnamWest IndiesWestern AfricaWestern AsiaWestern EuropeYemenZaireZimbabweAzores
Unemployment Among Women with Children Ages 6 to 17 years
Income
Poverty
Unemployment
Labor Participation
Family Structure
Vehicle Availability
Education Level
Disability

Unemployment Among Women with Children Ages 6 to 17 years Comparison

Arabs

Immigrants from Argentina

Tragic
Excellent
9.3%
UNEMPLOYMENT AMONG WOMEN WITH CHILDREN AGES 6 TO 17 YEARS
2.7/ 100
METRIC RATING
238th/ 347
METRIC RANK
8.7%
UNEMPLOYMENT AMONG WOMEN WITH CHILDREN AGES 6 TO 17 YEARS
90.0/ 100
METRIC RATING
137th/ 347
METRIC RANK

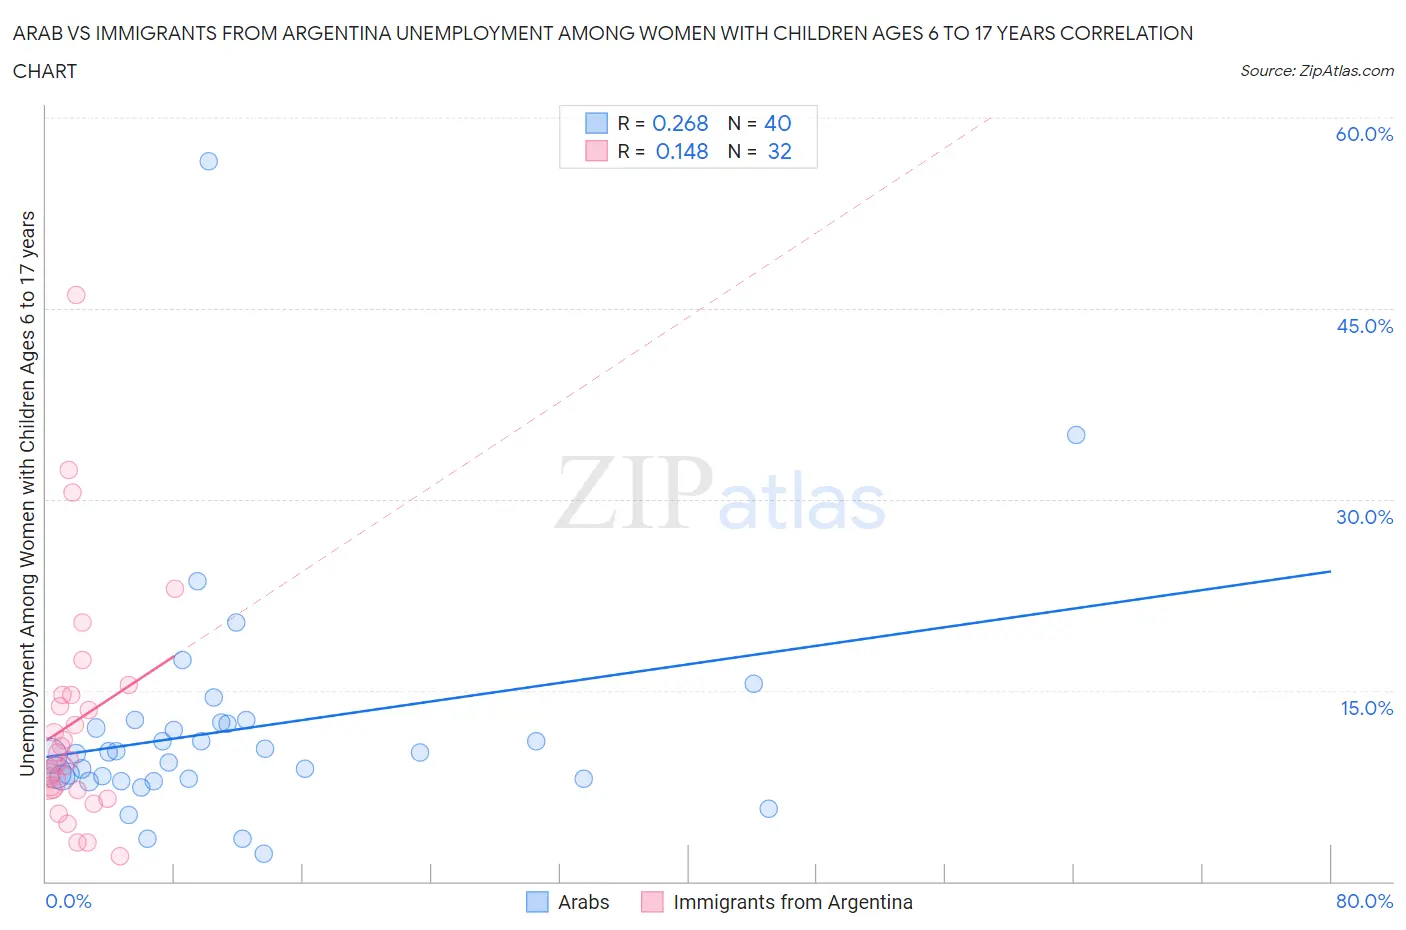
Arab vs Immigrants from Argentina Unemployment Among Women with Children Ages 6 to 17 years Correlation Chart

The statistical analysis conducted on geographies consisting of 331,347,771 people shows a weak positive correlation between the proportion of Arabs and unemployment rate among women with children between the ages 6 and 17 in the United States with a correlation coefficient (R) of 0.268 and weighted average of 9.3%. Similarly, the statistical analysis conducted on geographies consisting of 206,042,405 people shows a poor positive correlation between the proportion of Immigrants from Argentina and unemployment rate among women with children between the ages 6 and 17 in the United States with a correlation coefficient (R) of 0.148 and weighted average of 8.7%, a difference of 6.6%.
Arab vs Immigrants from Argentina Unemployment Among Women with Children Ages 6 to 17 years

Unemployment Among Women with Children Ages 6 to 17 years Correlation Summary

MeasurementArabImmigrants from Argentina
Minimum2.2%2.0%
Maximum56.6%46.1%
Range54.4%44.1%
Mean11.9%12.6%
Median10.1%9.8%
Interquartile 25% (IQ1)8.1%7.2%
Interquartile 75% (IQ3)12.4%14.6%
Interquartile Range (IQR)4.4%7.4%
Standard Deviation (Sample)9.2%9.4%
Standard Deviation (Population)9.1%9.2%

Similar Demographics by Unemployment Among Women with Children Ages 6 to 17 years

Demographics Similar to Arabs by Unemployment Among Women with Children Ages 6 to 17 years

In terms of unemployment among women with children ages 6 to 17 years, the demographic groups most similar to Arabs are Immigrants from Saudi Arabia (9.3%, a difference of 0.0%), Immigrants from Belize (9.3%, a difference of 0.080%), Hungarian (9.3%, a difference of 0.12%), Guatemalan (9.3%, a difference of 0.14%), and Uruguayan (9.3%, a difference of 0.15%).
DemographicsRating | RankUnemployment Among Women with Children Ages 6 to 17 years
Macedonians
3.9
/100
|
#231
Tragic
9.3%
French American Indians
3.7
/100
|
#232
Tragic
9.3%
Immigrants | St. Vincent and the Grenadines
3.3
/100
|
#233
Tragic
9.3%
Mexicans
3.2
/100
|
#234
Tragic
9.3%
Uruguayans
3.0
/100
|
#235
Tragic
9.3%
Hungarians
3.0
/100
|
#236
Tragic
9.3%
Immigrants | Belize
2.8
/100
|
#237
Tragic
9.3%
Arabs
2.7
/100
|
#238
Tragic
9.3%
Immigrants | Saudi Arabia
2.7
/100
|
#239
Tragic
9.3%
Guatemalans
2.3
/100
|
#240
Tragic
9.3%
Colombians
2.2
/100
|
#241
Tragic
9.3%
Immigrants | Colombia
2.1
/100
|
#242
Tragic
9.3%
Scottish
2.0
/100
|
#243
Tragic
9.4%
English
1.9
/100
|
#244
Tragic
9.4%
Immigrants | Cameroon
1.8
/100
|
#245
Tragic
9.4%

Demographics Similar to Immigrants from Argentina by Unemployment Among Women with Children Ages 6 to 17 years

In terms of unemployment among women with children ages 6 to 17 years, the demographic groups most similar to Immigrants from Argentina are Immigrants from Latvia (8.7%, a difference of 0.050%), Immigrants from Ethiopia (8.8%, a difference of 0.060%), European (8.7%, a difference of 0.080%), Northern European (8.8%, a difference of 0.090%), and Immigrants from Ireland (8.7%, a difference of 0.14%).
DemographicsRating | RankUnemployment Among Women with Children Ages 6 to 17 years
Immigrants | Western Asia
93.1
/100
|
#130
Exceptional
8.7%
Slavs
92.2
/100
|
#131
Exceptional
8.7%
Yaqui
92.2
/100
|
#132
Exceptional
8.7%
Egyptians
91.8
/100
|
#133
Exceptional
8.7%
Immigrants | Ireland
91.0
/100
|
#134
Exceptional
8.7%
Europeans
90.6
/100
|
#135
Exceptional
8.7%
Immigrants | Latvia
90.4
/100
|
#136
Exceptional
8.7%
Immigrants | Argentina
90.0
/100
|
#137
Excellent
8.7%
Immigrants | Ethiopia
89.5
/100
|
#138
Excellent
8.8%
Northern Europeans
89.2
/100
|
#139
Excellent
8.8%
Immigrants | Poland
88.3
/100
|
#140
Excellent
8.8%
Serbians
87.6
/100
|
#141
Excellent
8.8%
Immigrants | Austria
87.5
/100
|
#142
Excellent
8.8%
Immigrants | Kenya
86.1
/100
|
#143
Excellent
8.8%
Russians
85.8
/100
|
#144
Excellent
8.8%