Arab vs Celtic Unemployment Among Women with Children Ages 6 to 17 years
COMPARE
Arab
Celtic
Unemployment Among Women with Children Ages 6 to 17 years
Unemployment Among Women with Children Ages 6 to 17 years Comparison
Arabs
Celtics
9.3%
UNEMPLOYMENT AMONG WOMEN WITH CHILDREN AGES 6 TO 17 YEARS
2.7/ 100
METRIC RATING
238th/ 347
METRIC RANK
9.5%
UNEMPLOYMENT AMONG WOMEN WITH CHILDREN AGES 6 TO 17 YEARS
0.7/ 100
METRIC RATING
257th/ 347
METRIC RANK
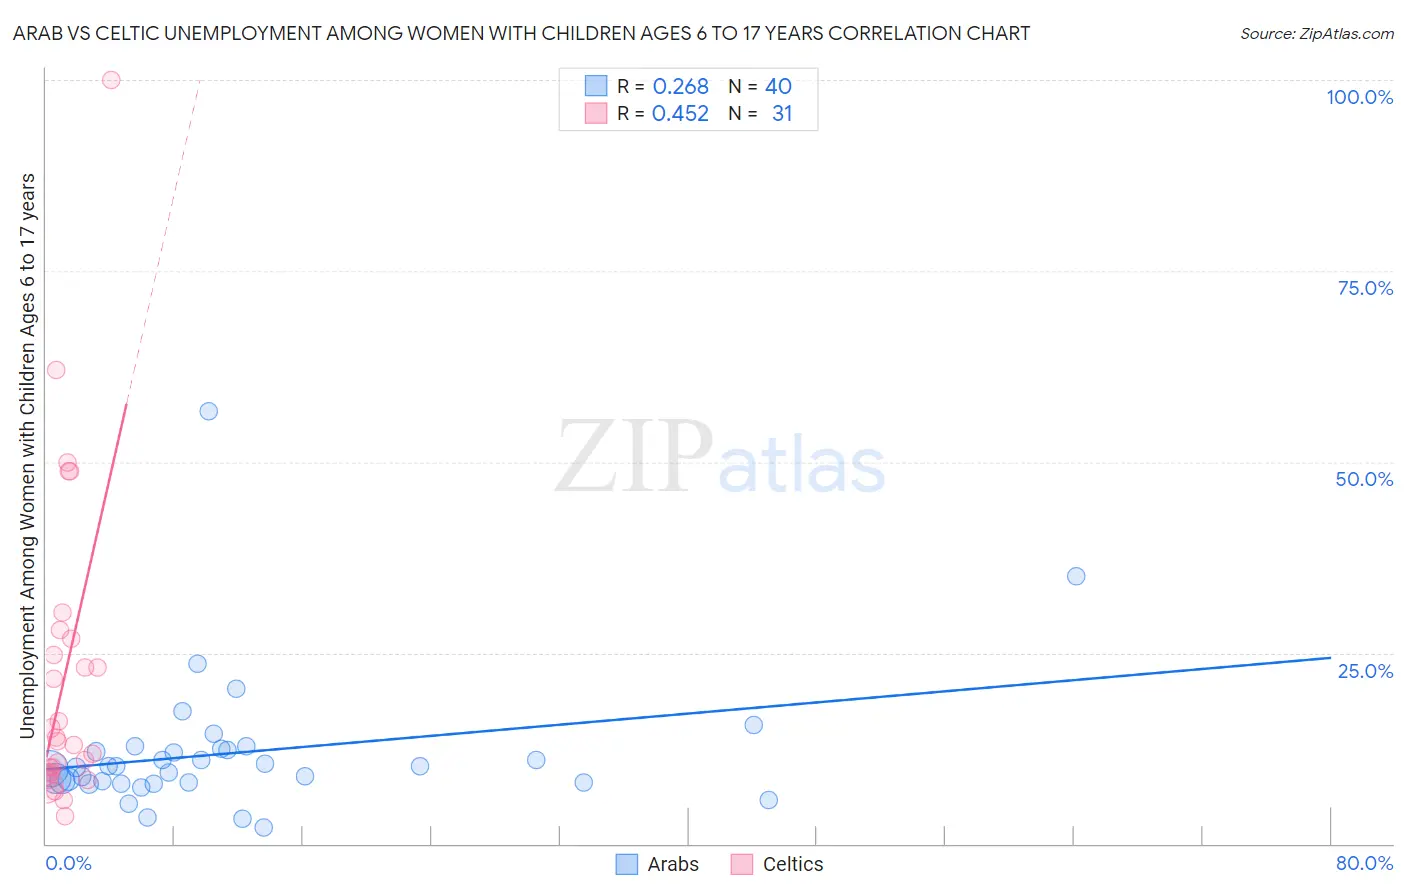
Arab vs Celtic Unemployment Among Women with Children Ages 6 to 17 years Correlation Chart
The statistical analysis conducted on geographies consisting of 331,347,771 people shows a weak positive correlation between the proportion of Arabs and unemployment rate among women with children between the ages 6 and 17 in the United States with a correlation coefficient (R) of 0.268 and weighted average of 9.3%. Similarly, the statistical analysis conducted on geographies consisting of 135,093,313 people shows a moderate positive correlation between the proportion of Celtics and unemployment rate among women with children between the ages 6 and 17 in the United States with a correlation coefficient (R) of 0.452 and weighted average of 9.5%, a difference of 1.4%.
Unemployment Among Women with Children Ages 6 to 17 years Correlation Summary
| Measurement | Arab | Celtic |
| Minimum | 2.2% | 3.7% |
| Maximum | 56.6% | 100.0% |
| Range | 54.4% | 96.3% |
| Mean | 11.9% | 21.9% |
| Median | 10.1% | 13.4% |
| Interquartile 25% (IQ1) | 8.1% | 9.3% |
| Interquartile 75% (IQ3) | 12.4% | 26.8% |
| Interquartile Range (IQR) | 4.4% | 17.5% |
| Standard Deviation (Sample) | 9.2% | 20.7% |
| Standard Deviation (Population) | 9.1% | 20.4% |
Demographics Similar to Arabs and Celtics by Unemployment Among Women with Children Ages 6 to 17 years
In terms of unemployment among women with children ages 6 to 17 years, the demographic groups most similar to Arabs are Immigrants from Saudi Arabia (9.3%, a difference of 0.0%), Immigrants from Belize (9.3%, a difference of 0.080%), Guatemalan (9.3%, a difference of 0.14%), Colombian (9.3%, a difference of 0.22%), and Immigrants from Colombia (9.3%, a difference of 0.23%). Similarly, the demographic groups most similar to Celtics are Canadian (9.4%, a difference of 0.020%), Lithuanian (9.4%, a difference of 0.19%), Nicaraguan (9.4%, a difference of 0.26%), Portuguese (9.4%, a difference of 0.43%), and Creek (9.4%, a difference of 0.52%).
| Demographics | Rating | Rank | Unemployment Among Women with Children Ages 6 to 17 years |
| Immigrants | Belize | 2.8 /100 | #237 | Tragic 9.3% |
| Arabs | 2.7 /100 | #238 | Tragic 9.3% |
| Immigrants | Saudi Arabia | 2.7 /100 | #239 | Tragic 9.3% |
| Guatemalans | 2.3 /100 | #240 | Tragic 9.3% |
| Colombians | 2.2 /100 | #241 | Tragic 9.3% |
| Immigrants | Colombia | 2.1 /100 | #242 | Tragic 9.3% |
| Scottish | 2.0 /100 | #243 | Tragic 9.4% |
| English | 1.9 /100 | #244 | Tragic 9.4% |
| Immigrants | Cameroon | 1.8 /100 | #245 | Tragic 9.4% |
| Immigrants | Africa | 1.6 /100 | #246 | Tragic 9.4% |
| Poles | 1.5 /100 | #247 | Tragic 9.4% |
| Dutch | 1.5 /100 | #248 | Tragic 9.4% |
| Immigrants | South America | 1.5 /100 | #249 | Tragic 9.4% |
| Immigrants | Guatemala | 1.3 /100 | #250 | Tragic 9.4% |
| Central Americans | 1.3 /100 | #251 | Tragic 9.4% |
| Creek | 1.2 /100 | #252 | Tragic 9.4% |
| Portuguese | 1.1 /100 | #253 | Tragic 9.4% |
| Nicaraguans | 1.0 /100 | #254 | Tragic 9.4% |
| Lithuanians | 0.9 /100 | #255 | Tragic 9.4% |
| Canadians | 0.8 /100 | #256 | Tragic 9.4% |
| Celtics | 0.7 /100 | #257 | Tragic 9.5% |