American vs Nonimmigrants Male Unemployment
COMPARE
American
Nonimmigrants
Male Unemployment
Male Unemployment Comparison
Americans
Nonimmigrants
5.2%
MALE UNEMPLOYMENT
72.7/ 100
METRIC RATING
156th/ 347
METRIC RANK
5.4%
MALE UNEMPLOYMENT
13.1/ 100
METRIC RATING
202nd/ 347
METRIC RANK
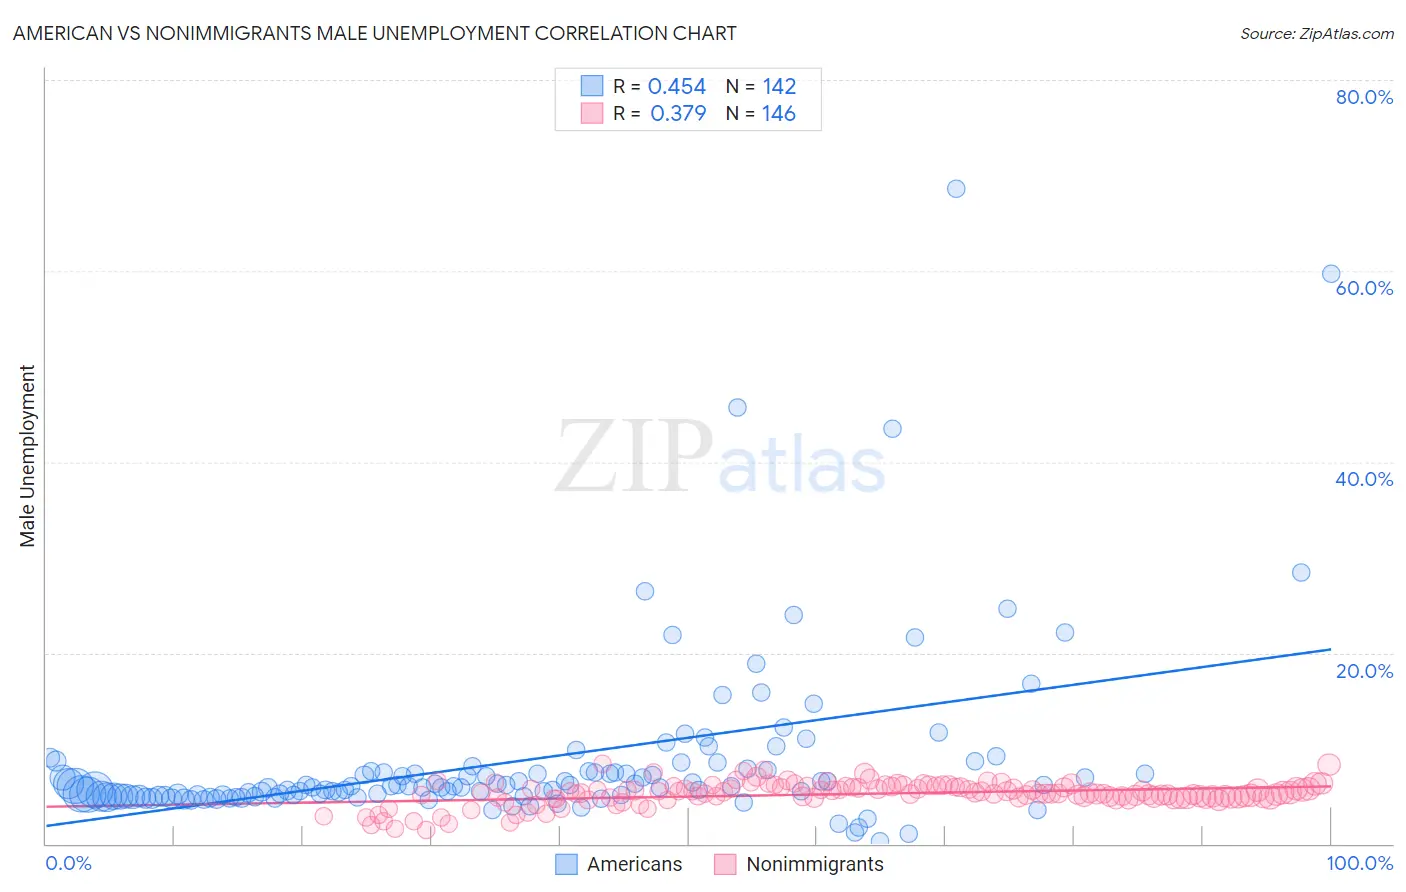
American vs Nonimmigrants Male Unemployment Correlation Chart
The statistical analysis conducted on geographies consisting of 568,902,342 people shows a moderate positive correlation between the proportion of Americans and unemployment rate among males in the United States with a correlation coefficient (R) of 0.454 and weighted average of 5.2%. Similarly, the statistical analysis conducted on geographies consisting of 570,841,743 people shows a mild positive correlation between the proportion of Nonimmigrants and unemployment rate among males in the United States with a correlation coefficient (R) of 0.379 and weighted average of 5.4%, a difference of 4.3%.
Male Unemployment Correlation Summary
| Measurement | American | Nonimmigrants |
| Minimum | 0.30% | 1.5% |
| Maximum | 68.6% | 8.4% |
| Range | 68.3% | 6.9% |
| Mean | 8.7% | 5.2% |
| Median | 6.0% | 5.3% |
| Interquartile 25% (IQ1) | 5.0% | 4.8% |
| Interquartile 75% (IQ3) | 7.6% | 5.9% |
| Interquartile Range (IQR) | 2.6% | 1.1% |
| Standard Deviation (Sample) | 9.3% | 1.2% |
| Standard Deviation (Population) | 9.3% | 1.2% |
Similar Demographics by Male Unemployment
Demographics Similar to Americans by Male Unemployment
In terms of male unemployment, the demographic groups most similar to Americans are Immigrants from Northern Africa (5.2%, a difference of 0.030%), Immigrants from Hungary (5.2%, a difference of 0.060%), Immigrants from Indonesia (5.2%, a difference of 0.080%), Immigrants from Uruguay (5.2%, a difference of 0.090%), and Laotian (5.2%, a difference of 0.090%).
| Demographics | Rating | Rank | Male Unemployment |
| Immigrants | Europe | 76.2 /100 | #149 | Good 5.2% |
| Indians (Asian) | 76.0 /100 | #150 | Good 5.2% |
| Slovaks | 75.5 /100 | #151 | Good 5.2% |
| Egyptians | 74.8 /100 | #152 | Good 5.2% |
| Immigrants | Uruguay | 73.9 /100 | #153 | Good 5.2% |
| Laotians | 73.8 /100 | #154 | Good 5.2% |
| Immigrants | Hungary | 73.4 /100 | #155 | Good 5.2% |
| Americans | 72.7 /100 | #156 | Good 5.2% |
| Immigrants | Northern Africa | 72.3 /100 | #157 | Good 5.2% |
| Immigrants | Indonesia | 71.5 /100 | #158 | Good 5.2% |
| Indonesians | 71.2 /100 | #159 | Good 5.2% |
| Immigrants | Norway | 71.0 /100 | #160 | Good 5.2% |
| Immigrants | China | 70.6 /100 | #161 | Good 5.2% |
| Immigrants | Egypt | 65.9 /100 | #162 | Good 5.2% |
| Immigrants | Hong Kong | 65.7 /100 | #163 | Good 5.2% |
Demographics Similar to Nonimmigrants by Male Unemployment
In terms of male unemployment, the demographic groups most similar to Nonimmigrants are Immigrants from Laos (5.4%, a difference of 0.010%), Immigrants from Philippines (5.4%, a difference of 0.040%), Immigrants from Zaire (5.4%, a difference of 0.070%), Guamanian/Chamorro (5.4%, a difference of 0.10%), and Immigrants from Greece (5.4%, a difference of 0.16%).
| Demographics | Rating | Rank | Male Unemployment |
| Immigrants | Southern Europe | 17.7 /100 | #195 | Poor 5.4% |
| Albanians | 17.3 /100 | #196 | Poor 5.4% |
| Alsatians | 16.7 /100 | #197 | Poor 5.4% |
| Immigrants | Thailand | 14.7 /100 | #198 | Poor 5.4% |
| Immigrants | Greece | 14.5 /100 | #199 | Poor 5.4% |
| Immigrants | Zaire | 13.7 /100 | #200 | Poor 5.4% |
| Immigrants | Philippines | 13.5 /100 | #201 | Poor 5.4% |
| Immigrants | Nonimmigrants | 13.1 /100 | #202 | Poor 5.4% |
| Immigrants | Laos | 13.0 /100 | #203 | Poor 5.4% |
| Guamanians/Chamorros | 12.3 /100 | #204 | Poor 5.4% |
| Immigrants | Costa Rica | 11.4 /100 | #205 | Poor 5.5% |
| Immigrants | Ukraine | 9.9 /100 | #206 | Tragic 5.5% |
| Immigrants | Syria | 9.3 /100 | #207 | Tragic 5.5% |
| Immigrants | Lebanon | 8.6 /100 | #208 | Tragic 5.5% |
| Immigrants | Middle Africa | 8.3 /100 | #209 | Tragic 5.5% |