Aleut vs Immigrants from St. Vincent and the Grenadines Unemployment Among Ages 35 to 44 years
COMPARE
Aleut
Immigrants from St. Vincent and the Grenadines
Unemployment Among Ages 35 to 44 years
Unemployment Among Ages 35 to 44 years Comparison
Aleuts
Immigrants from St. Vincent and the Grenadines
5.6%
UNEMPLOYMENT AMONG AGES 35 TO 44 YEARS
0.0/ 100
METRIC RATING
298th/ 347
METRIC RANK
6.2%
UNEMPLOYMENT AMONG AGES 35 TO 44 YEARS
0.0/ 100
METRIC RATING
317th/ 347
METRIC RANK
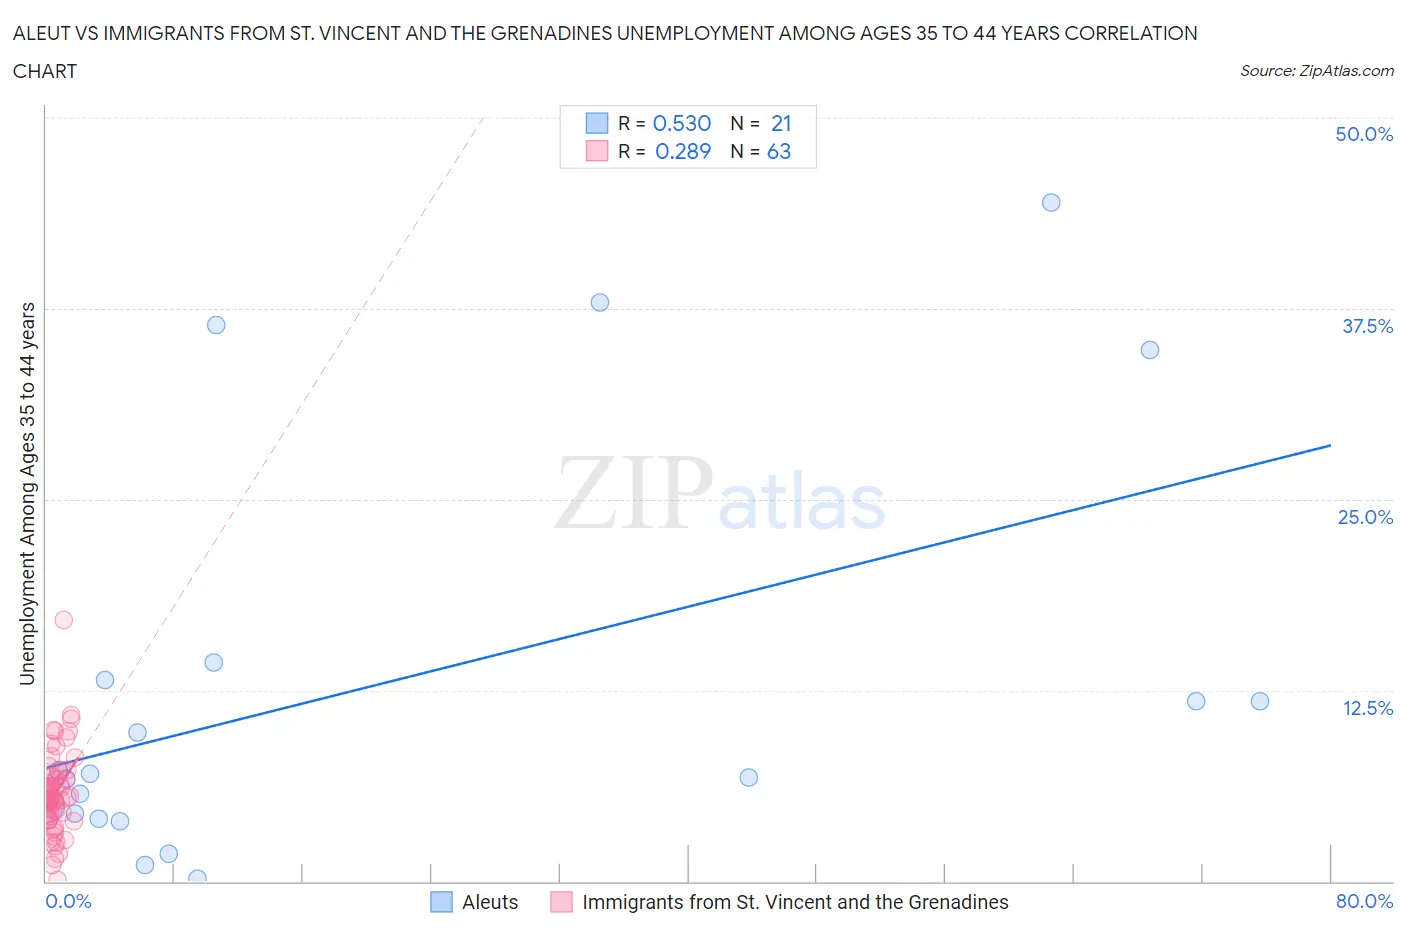
Aleut vs Immigrants from St. Vincent and the Grenadines Unemployment Among Ages 35 to 44 years Correlation Chart
The statistical analysis conducted on geographies consisting of 61,419,128 people shows a substantial positive correlation between the proportion of Aleuts and unemployment rate among population between the ages 35 and 44 in the United States with a correlation coefficient (R) of 0.530 and weighted average of 5.6%. Similarly, the statistical analysis conducted on geographies consisting of 56,040,595 people shows a weak positive correlation between the proportion of Immigrants from St. Vincent and the Grenadines and unemployment rate among population between the ages 35 and 44 in the United States with a correlation coefficient (R) of 0.289 and weighted average of 6.2%, a difference of 10.6%.
Unemployment Among Ages 35 to 44 years Correlation Summary
| Measurement | Aleut | Immigrants from St. Vincent and the Grenadines |
| Minimum | 0.20% | 0.10% |
| Maximum | 44.4% | 17.1% |
| Range | 44.2% | 17.0% |
| Mean | 12.8% | 5.8% |
| Median | 7.1% | 5.4% |
| Interquartile 25% (IQ1) | 4.3% | 4.0% |
| Interquartile 75% (IQ3) | 13.8% | 6.9% |
| Interquartile Range (IQR) | 9.5% | 2.9% |
| Standard Deviation (Sample) | 13.4% | 2.7% |
| Standard Deviation (Population) | 13.0% | 2.7% |
Demographics Similar to Aleuts and Immigrants from St. Vincent and the Grenadines by Unemployment Among Ages 35 to 44 years
In terms of unemployment among ages 35 to 44 years, the demographic groups most similar to Aleuts are U.S. Virgin Islander (5.6%, a difference of 0.010%), Immigrants from Jamaica (5.6%, a difference of 0.10%), Immigrants from West Indies (5.6%, a difference of 0.15%), African (5.6%, a difference of 0.20%), and Nepalese (5.6%, a difference of 0.32%). Similarly, the demographic groups most similar to Immigrants from St. Vincent and the Grenadines are Tsimshian (6.2%, a difference of 0.19%), Black/African American (6.1%, a difference of 1.0%), Immigrants from Dominica (6.0%, a difference of 2.9%), British West Indian (6.0%, a difference of 3.2%), and Immigrants from Guyana (6.0%, a difference of 3.4%).
| Demographics | Rating | Rank | Unemployment Among Ages 35 to 44 years |
| U.S. Virgin Islanders | 0.0 /100 | #297 | Tragic 5.6% |
| Aleuts | 0.0 /100 | #298 | Tragic 5.6% |
| Immigrants | Jamaica | 0.0 /100 | #299 | Tragic 5.6% |
| Immigrants | West Indies | 0.0 /100 | #300 | Tragic 5.6% |
| Africans | 0.0 /100 | #301 | Tragic 5.6% |
| Nepalese | 0.0 /100 | #302 | Tragic 5.6% |
| Yakama | 0.0 /100 | #303 | Tragic 5.6% |
| West Indians | 0.0 /100 | #304 | Tragic 5.7% |
| Belizeans | 0.0 /100 | #305 | Tragic 5.7% |
| Barbadians | 0.0 /100 | #306 | Tragic 5.7% |
| Immigrants | Belize | 0.0 /100 | #307 | Tragic 5.8% |
| Immigrants | Azores | 0.0 /100 | #308 | Tragic 5.8% |
| Immigrants | Barbados | 0.0 /100 | #309 | Tragic 5.8% |
| Guyanese | 0.0 /100 | #310 | Tragic 5.9% |
| Marshallese | 0.0 /100 | #311 | Tragic 5.9% |
| Immigrants | Guyana | 0.0 /100 | #312 | Tragic 6.0% |
| British West Indians | 0.0 /100 | #313 | Tragic 6.0% |
| Immigrants | Dominica | 0.0 /100 | #314 | Tragic 6.0% |
| Blacks/African Americans | 0.0 /100 | #315 | Tragic 6.1% |
| Tsimshian | 0.0 /100 | #316 | Tragic 6.2% |
| Immigrants | St. Vincent and the Grenadines | 0.0 /100 | #317 | Tragic 6.2% |