Sierra Leonean vs Immigrants from St. Vincent and the Grenadines Unemployment Among Ages 35 to 44 years
COMPARE
Sierra Leonean
Immigrants from St. Vincent and the Grenadines
Unemployment Among Ages 35 to 44 years
Unemployment Among Ages 35 to 44 years Comparison
Sierra Leoneans
Immigrants from St. Vincent and the Grenadines
4.9%
UNEMPLOYMENT AMONG AGES 35 TO 44 YEARS
4.8/ 100
METRIC RATING
219th/ 347
METRIC RANK
6.2%
UNEMPLOYMENT AMONG AGES 35 TO 44 YEARS
0.0/ 100
METRIC RATING
317th/ 347
METRIC RANK
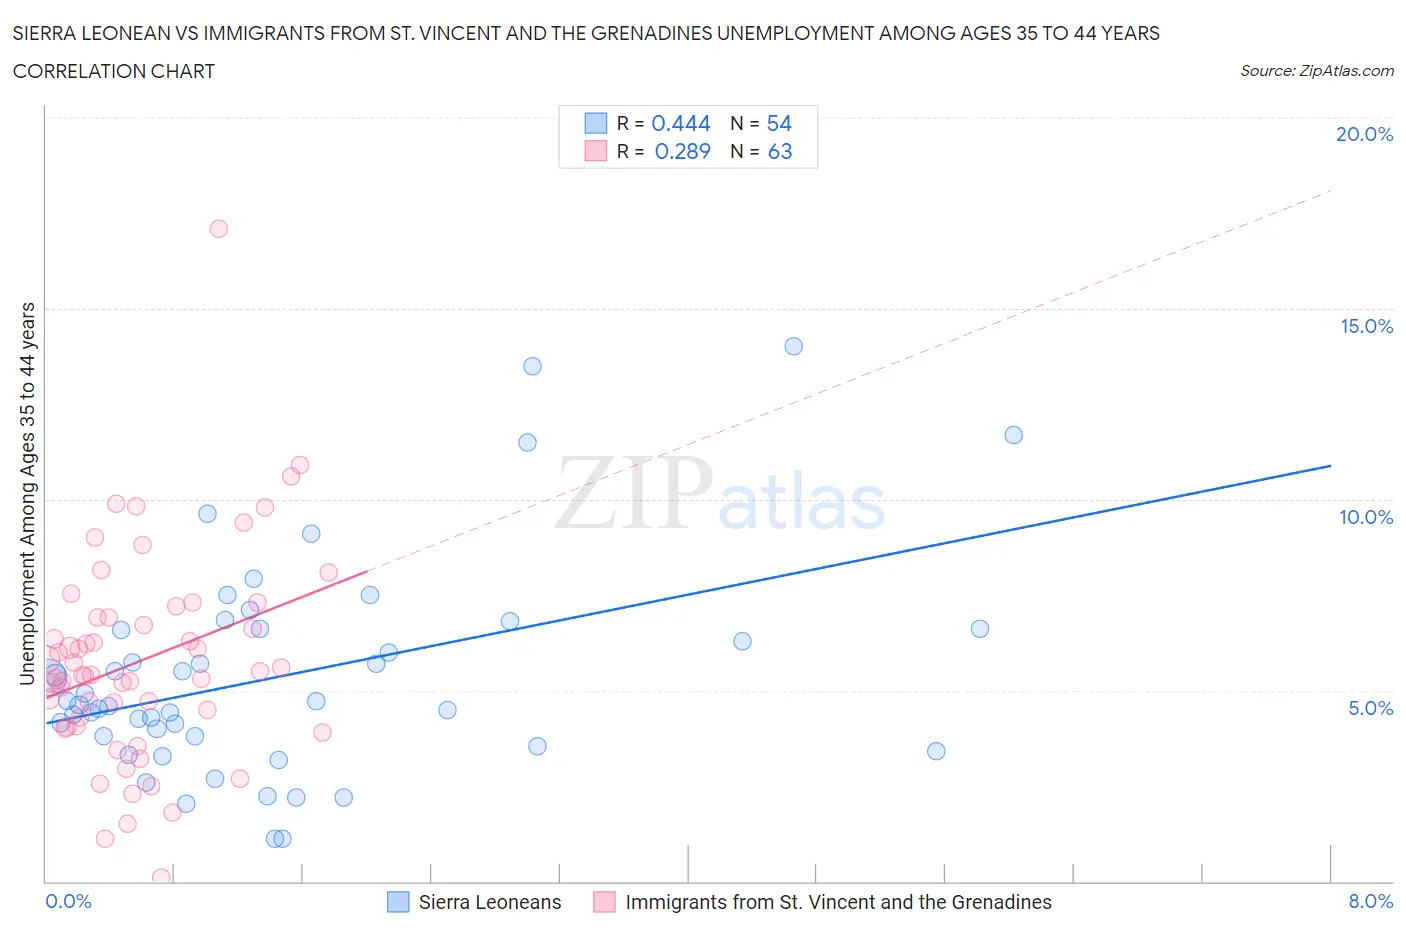
Sierra Leonean vs Immigrants from St. Vincent and the Grenadines Unemployment Among Ages 35 to 44 years Correlation Chart
The statistical analysis conducted on geographies consisting of 83,049,216 people shows a moderate positive correlation between the proportion of Sierra Leoneans and unemployment rate among population between the ages 35 and 44 in the United States with a correlation coefficient (R) of 0.444 and weighted average of 4.9%. Similarly, the statistical analysis conducted on geographies consisting of 56,040,595 people shows a weak positive correlation between the proportion of Immigrants from St. Vincent and the Grenadines and unemployment rate among population between the ages 35 and 44 in the United States with a correlation coefficient (R) of 0.289 and weighted average of 6.2%, a difference of 24.9%.
Unemployment Among Ages 35 to 44 years Correlation Summary
| Measurement | Sierra Leonean | Immigrants from St. Vincent and the Grenadines |
| Minimum | 1.1% | 0.10% |
| Maximum | 14.0% | 17.1% |
| Range | 12.9% | 17.0% |
| Mean | 5.4% | 5.8% |
| Median | 4.7% | 5.4% |
| Interquartile 25% (IQ1) | 3.8% | 4.0% |
| Interquartile 75% (IQ3) | 6.6% | 6.9% |
| Interquartile Range (IQR) | 2.8% | 2.9% |
| Standard Deviation (Sample) | 2.8% | 2.7% |
| Standard Deviation (Population) | 2.8% | 2.7% |
Similar Demographics by Unemployment Among Ages 35 to 44 years
Demographics Similar to Sierra Leoneans by Unemployment Among Ages 35 to 44 years
In terms of unemployment among ages 35 to 44 years, the demographic groups most similar to Sierra Leoneans are Immigrants from Sierra Leone (4.9%, a difference of 0.030%), Chickasaw (4.9%, a difference of 0.31%), Bermudan (5.0%, a difference of 0.35%), Moroccan (4.9%, a difference of 0.42%), and American (4.9%, a difference of 0.46%).
| Demographics | Rating | Rank | Unemployment Among Ages 35 to 44 years |
| Fijians | 8.7 /100 | #212 | Tragic 4.9% |
| Osage | 8.6 /100 | #213 | Tragic 4.9% |
| Immigrants | Africa | 8.2 /100 | #214 | Tragic 4.9% |
| Immigrants | Immigrants | 8.0 /100 | #215 | Tragic 4.9% |
| Americans | 6.2 /100 | #216 | Tragic 4.9% |
| Moroccans | 6.0 /100 | #217 | Tragic 4.9% |
| Chickasaw | 5.7 /100 | #218 | Tragic 4.9% |
| Sierra Leoneans | 4.8 /100 | #219 | Tragic 4.9% |
| Immigrants | Sierra Leone | 4.7 /100 | #220 | Tragic 4.9% |
| Bermudans | 3.9 /100 | #221 | Tragic 5.0% |
| Hmong | 3.5 /100 | #222 | Tragic 5.0% |
| Immigrants | Panama | 3.3 /100 | #223 | Tragic 5.0% |
| Panamanians | 2.9 /100 | #224 | Tragic 5.0% |
| Immigrants | Lebanon | 2.7 /100 | #225 | Tragic 5.0% |
| Potawatomi | 2.5 /100 | #226 | Tragic 5.0% |
Demographics Similar to Immigrants from St. Vincent and the Grenadines by Unemployment Among Ages 35 to 44 years
In terms of unemployment among ages 35 to 44 years, the demographic groups most similar to Immigrants from St. Vincent and the Grenadines are Tsimshian (6.2%, a difference of 0.19%), Colville (6.2%, a difference of 0.41%), Immigrants from Grenada (6.2%, a difference of 0.67%), Immigrants from Armenia (6.2%, a difference of 0.91%), and Chippewa (6.2%, a difference of 0.97%).
| Demographics | Rating | Rank | Unemployment Among Ages 35 to 44 years |
| Guyanese | 0.0 /100 | #310 | Tragic 5.9% |
| Marshallese | 0.0 /100 | #311 | Tragic 5.9% |
| Immigrants | Guyana | 0.0 /100 | #312 | Tragic 6.0% |
| British West Indians | 0.0 /100 | #313 | Tragic 6.0% |
| Immigrants | Dominica | 0.0 /100 | #314 | Tragic 6.0% |
| Blacks/African Americans | 0.0 /100 | #315 | Tragic 6.1% |
| Tsimshian | 0.0 /100 | #316 | Tragic 6.2% |
| Immigrants | St. Vincent and the Grenadines | 0.0 /100 | #317 | Tragic 6.2% |
| Colville | 0.0 /100 | #318 | Tragic 6.2% |
| Immigrants | Grenada | 0.0 /100 | #319 | Tragic 6.2% |
| Immigrants | Armenia | 0.0 /100 | #320 | Tragic 6.2% |
| Chippewa | 0.0 /100 | #321 | Tragic 6.2% |
| Immigrants | Dominican Republic | 0.0 /100 | #322 | Tragic 6.4% |
| Dominicans | 0.0 /100 | #323 | Tragic 6.4% |
| Menominee | 0.0 /100 | #324 | Tragic 6.5% |