Aleut vs Immigrants from St. Vincent and the Grenadines 6th Grade
COMPARE
Aleut
Immigrants from St. Vincent and the Grenadines
6th Grade
6th Grade Comparison
Aleuts
Immigrants from St. Vincent and the Grenadines
97.7%
6TH GRADE
99.8/ 100
METRIC RATING
55th/ 347
METRIC RANK
96.1%
6TH GRADE
0.0/ 100
METRIC RATING
291st/ 347
METRIC RANK
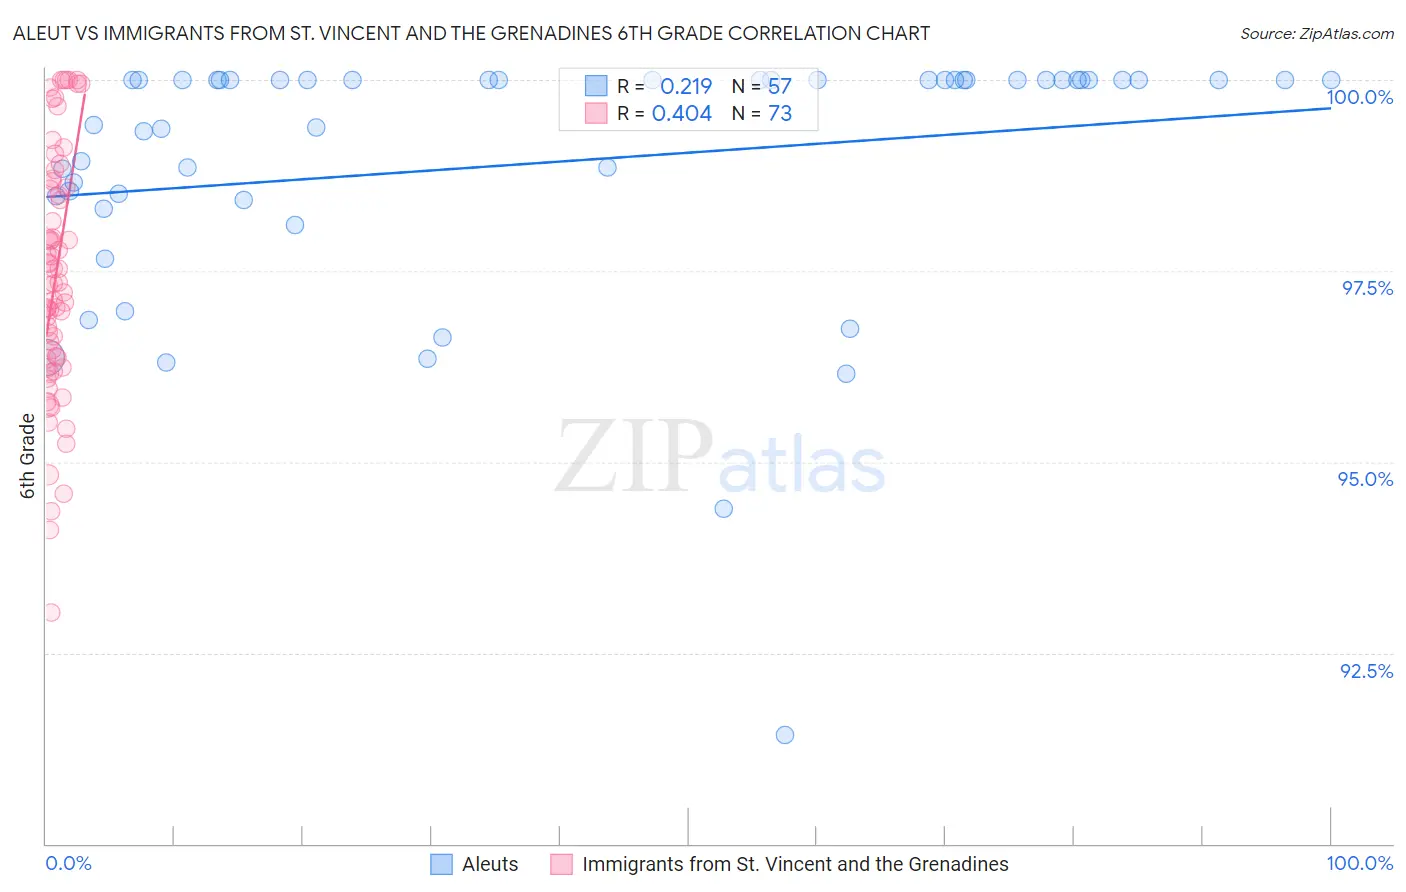
Aleut vs Immigrants from St. Vincent and the Grenadines 6th Grade Correlation Chart
The statistical analysis conducted on geographies consisting of 61,781,058 people shows a weak positive correlation between the proportion of Aleuts and percentage of population with at least 6th grade education in the United States with a correlation coefficient (R) of 0.219 and weighted average of 97.7%. Similarly, the statistical analysis conducted on geographies consisting of 56,191,418 people shows a moderate positive correlation between the proportion of Immigrants from St. Vincent and the Grenadines and percentage of population with at least 6th grade education in the United States with a correlation coefficient (R) of 0.404 and weighted average of 96.1%, a difference of 1.7%.
6th Grade Correlation Summary
| Measurement | Aleut | Immigrants from St. Vincent and the Grenadines |
| Minimum | 91.4% | 93.0% |
| Maximum | 100.0% | 100.0% |
| Range | 8.6% | 7.0% |
| Mean | 98.9% | 97.4% |
| Median | 100.0% | 97.3% |
| Interquartile 25% (IQ1) | 98.5% | 96.3% |
| Interquartile 75% (IQ3) | 100.0% | 98.6% |
| Interquartile Range (IQR) | 1.5% | 2.3% |
| Standard Deviation (Sample) | 1.7% | 1.6% |
| Standard Deviation (Population) | 1.7% | 1.6% |
Similar Demographics by 6th Grade
Demographics Similar to Aleuts by 6th Grade
In terms of 6th grade, the demographic groups most similar to Aleuts are Creek (97.7%, a difference of 0.0%), Maltese (97.8%, a difference of 0.010%), Australian (97.8%, a difference of 0.010%), Slavic (97.8%, a difference of 0.010%), and Austrian (97.7%, a difference of 0.010%).
| Demographics | Rating | Rank | 6th Grade |
| Celtics | 99.9 /100 | #48 | Exceptional 97.8% |
| Estonians | 99.8 /100 | #49 | Exceptional 97.8% |
| Immigrants | Scotland | 99.8 /100 | #50 | Exceptional 97.8% |
| Maltese | 99.8 /100 | #51 | Exceptional 97.8% |
| Australians | 99.8 /100 | #52 | Exceptional 97.8% |
| Slavs | 99.8 /100 | #53 | Exceptional 97.8% |
| Creek | 99.8 /100 | #54 | Exceptional 97.7% |
| Aleuts | 99.8 /100 | #55 | Exceptional 97.7% |
| Austrians | 99.8 /100 | #56 | Exceptional 97.7% |
| Whites/Caucasians | 99.8 /100 | #57 | Exceptional 97.7% |
| Greeks | 99.8 /100 | #58 | Exceptional 97.7% |
| Americans | 99.8 /100 | #59 | Exceptional 97.7% |
| Immigrants | Canada | 99.8 /100 | #60 | Exceptional 97.7% |
| Serbians | 99.7 /100 | #61 | Exceptional 97.7% |
| Immigrants | North America | 99.7 /100 | #62 | Exceptional 97.7% |
Demographics Similar to Immigrants from St. Vincent and the Grenadines by 6th Grade
In terms of 6th grade, the demographic groups most similar to Immigrants from St. Vincent and the Grenadines are Immigrants from Somalia (96.1%, a difference of 0.0%), Immigrants from Eritrea (96.1%, a difference of 0.020%), Immigrants from Barbados (96.1%, a difference of 0.020%), Malaysian (96.2%, a difference of 0.040%), and Immigrants from Trinidad and Tobago (96.2%, a difference of 0.050%).
| Demographics | Rating | Rank | 6th Grade |
| Fijians | 0.1 /100 | #284 | Tragic 96.2% |
| Somalis | 0.1 /100 | #285 | Tragic 96.2% |
| Barbadians | 0.0 /100 | #286 | Tragic 96.2% |
| Immigrants | Trinidad and Tobago | 0.0 /100 | #287 | Tragic 96.2% |
| Malaysians | 0.0 /100 | #288 | Tragic 96.2% |
| Immigrants | Eritrea | 0.0 /100 | #289 | Tragic 96.1% |
| Immigrants | Somalia | 0.0 /100 | #290 | Tragic 96.1% |
| Immigrants | St. Vincent and the Grenadines | 0.0 /100 | #291 | Tragic 96.1% |
| Immigrants | Barbados | 0.0 /100 | #292 | Tragic 96.1% |
| Immigrants | West Indies | 0.0 /100 | #293 | Tragic 96.1% |
| British West Indians | 0.0 /100 | #294 | Tragic 96.0% |
| Immigrants | Grenada | 0.0 /100 | #295 | Tragic 95.9% |
| Immigrants | South Eastern Asia | 0.0 /100 | #296 | Tragic 95.9% |
| Haitians | 0.0 /100 | #297 | Tragic 95.8% |
| Sri Lankans | 0.0 /100 | #298 | Tragic 95.8% |