Afghan vs Immigrants from Hungary Unemployment Among Ages 30 to 34 years
COMPARE
Afghan
Immigrants from Hungary
Unemployment Among Ages 30 to 34 years
Unemployment Among Ages 30 to 34 years Comparison
Afghans
Immigrants from Hungary
5.5%
UNEMPLOYMENT AMONG AGES 30 TO 34 YEARS
49.6/ 100
METRIC RATING
175th/ 347
METRIC RANK
5.4%
UNEMPLOYMENT AMONG AGES 30 TO 34 YEARS
66.1/ 100
METRIC RATING
155th/ 347
METRIC RANK
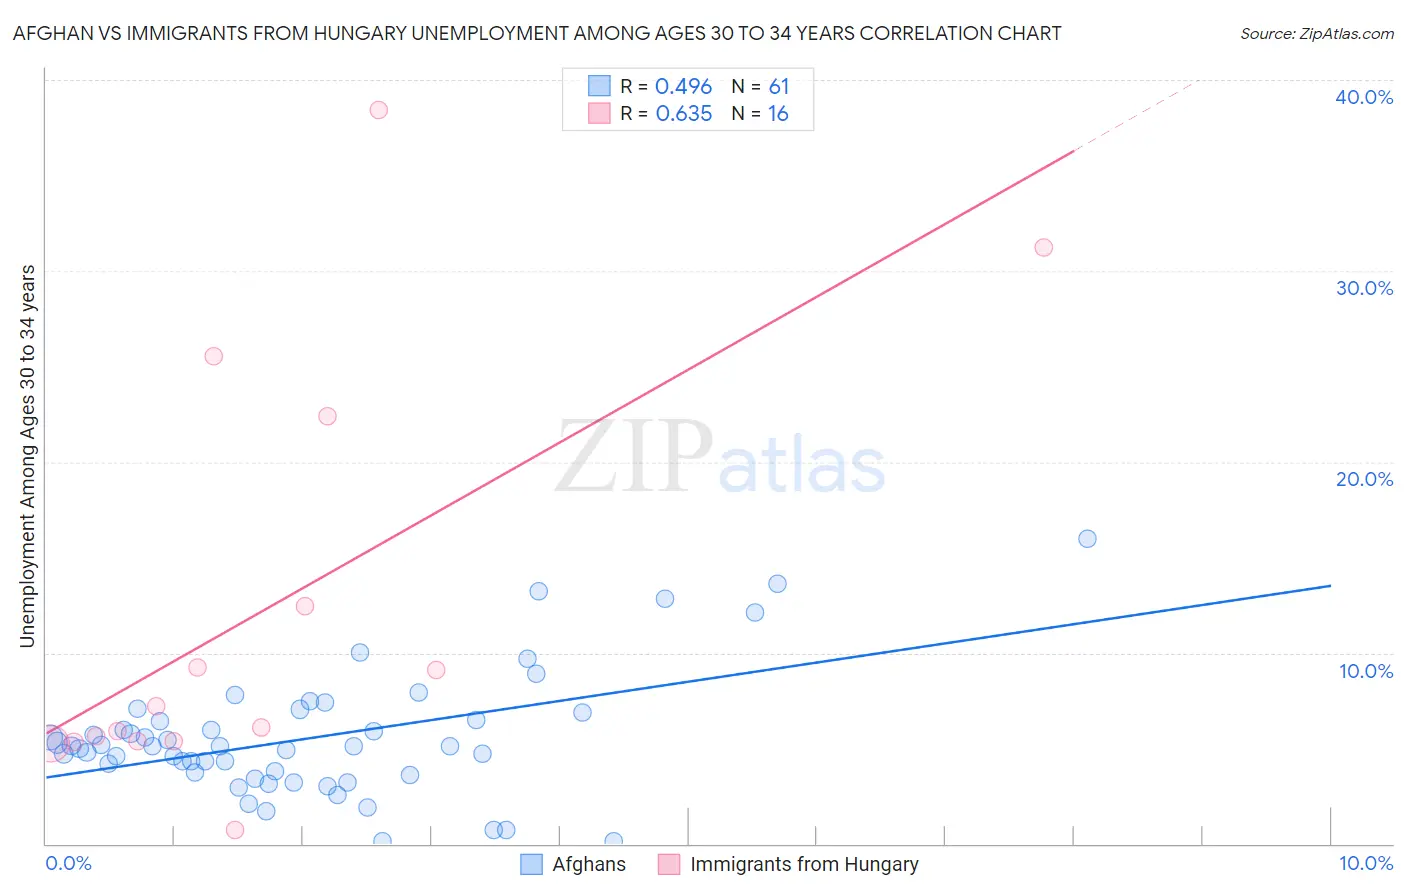
Afghan vs Immigrants from Hungary Unemployment Among Ages 30 to 34 years Correlation Chart
The statistical analysis conducted on geographies consisting of 146,572,734 people shows a moderate positive correlation between the proportion of Afghans and unemployment rate among population between the ages 30 and 34 in the United States with a correlation coefficient (R) of 0.496 and weighted average of 5.5%. Similarly, the statistical analysis conducted on geographies consisting of 188,875,856 people shows a significant positive correlation between the proportion of Immigrants from Hungary and unemployment rate among population between the ages 30 and 34 in the United States with a correlation coefficient (R) of 0.635 and weighted average of 5.4%, a difference of 1.2%.
Unemployment Among Ages 30 to 34 years Correlation Summary
| Measurement | Afghan | Immigrants from Hungary |
| Minimum | 0.10% | 0.74% |
| Maximum | 16.0% | 38.4% |
| Range | 15.9% | 37.7% |
| Mean | 5.5% | 12.2% |
| Median | 5.1% | 6.6% |
| Interquartile 25% (IQ1) | 3.7% | 5.4% |
| Interquartile 75% (IQ3) | 6.7% | 17.4% |
| Interquartile Range (IQR) | 3.0% | 12.0% |
| Standard Deviation (Sample) | 3.2% | 11.0% |
| Standard Deviation (Population) | 3.2% | 10.6% |
Demographics Similar to Afghans and Immigrants from Hungary by Unemployment Among Ages 30 to 34 years
In terms of unemployment among ages 30 to 34 years, the demographic groups most similar to Afghans are Immigrants from Laos (5.5%, a difference of 0.030%), Peruvian (5.5%, a difference of 0.040%), Immigrants from Austria (5.5%, a difference of 0.12%), Scottish (5.5%, a difference of 0.15%), and Dutch (5.5%, a difference of 0.21%). Similarly, the demographic groups most similar to Immigrants from Hungary are Czechoslovakian (5.4%, a difference of 0.18%), Albanian (5.4%, a difference of 0.19%), Immigrants from Belarus (5.4%, a difference of 0.26%), Immigrants from Croatia (5.4%, a difference of 0.38%), and Immigrants from Scotland (5.4%, a difference of 0.51%).
| Demographics | Rating | Rank | Unemployment Among Ages 30 to 34 years |
| Immigrants | Hungary | 66.1 /100 | #155 | Good 5.4% |
| Czechoslovakians | 63.7 /100 | #156 | Good 5.4% |
| Albanians | 63.7 /100 | #157 | Good 5.4% |
| Immigrants | Belarus | 62.7 /100 | #158 | Good 5.4% |
| Immigrants | Croatia | 61.0 /100 | #159 | Good 5.4% |
| Immigrants | Scotland | 59.3 /100 | #160 | Average 5.4% |
| Austrians | 59.0 /100 | #161 | Average 5.4% |
| Brazilians | 58.2 /100 | #162 | Average 5.4% |
| Arabs | 57.7 /100 | #163 | Average 5.4% |
| Basques | 57.3 /100 | #164 | Average 5.4% |
| Welsh | 56.3 /100 | #165 | Average 5.4% |
| Immigrants | Thailand | 55.6 /100 | #166 | Average 5.4% |
| English | 54.8 /100 | #167 | Average 5.4% |
| South Americans | 52.9 /100 | #168 | Average 5.4% |
| Immigrants | Israel | 52.9 /100 | #169 | Average 5.4% |
| Dutch | 52.6 /100 | #170 | Average 5.5% |
| Scottish | 51.8 /100 | #171 | Average 5.5% |
| Immigrants | Austria | 51.3 /100 | #172 | Average 5.5% |
| Peruvians | 50.2 /100 | #173 | Average 5.5% |
| Immigrants | Laos | 50.0 /100 | #174 | Average 5.5% |
| Afghans | 49.6 /100 | #175 | Average 5.5% |