Mexican vs Jamaican Female Poverty Among 25-34 Year Olds
COMPARE
Mexican
Jamaican
Female Poverty Among 25-34 Year Olds
Female Poverty Among 25-34 Year Olds Comparison
Mexicans
Jamaicans
16.6%
FEMALE POVERTY AMONG 25-34 YEAR OLDS
0.0/ 100
METRIC RATING
295th/ 347
METRIC RANK
14.8%
FEMALE POVERTY AMONG 25-34 YEAR OLDS
1.0/ 100
METRIC RATING
246th/ 347
METRIC RANK
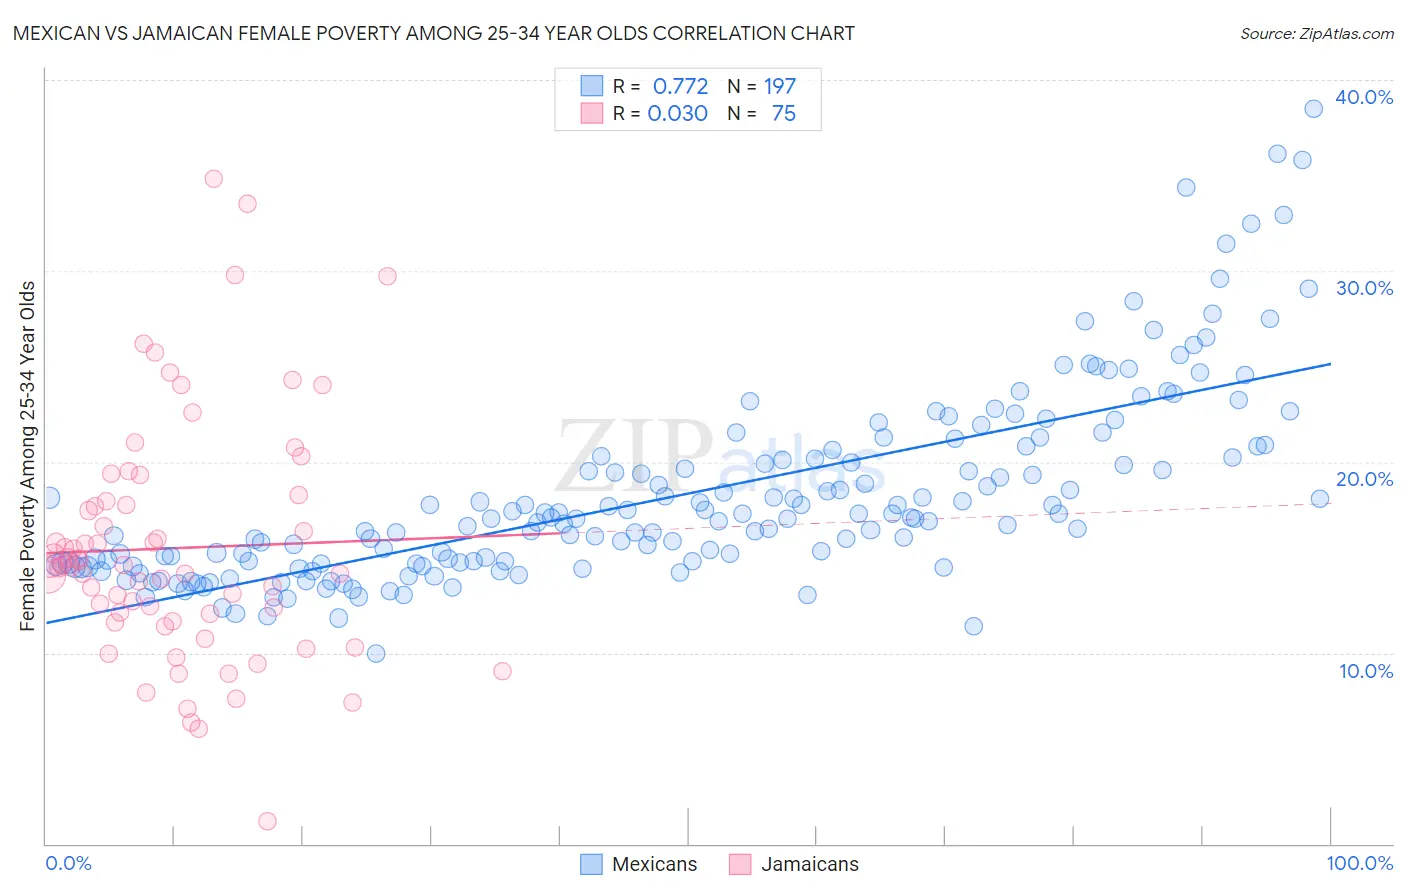
Mexican vs Jamaican Female Poverty Among 25-34 Year Olds Correlation Chart
The statistical analysis conducted on geographies consisting of 546,296,025 people shows a strong positive correlation between the proportion of Mexicans and poverty level among females between the ages 25 and 34 in the United States with a correlation coefficient (R) of 0.772 and weighted average of 16.6%. Similarly, the statistical analysis conducted on geographies consisting of 363,151,560 people shows no correlation between the proportion of Jamaicans and poverty level among females between the ages 25 and 34 in the United States with a correlation coefficient (R) of 0.030 and weighted average of 14.8%, a difference of 11.9%.
Female Poverty Among 25-34 Year Olds Correlation Summary
| Measurement | Mexican | Jamaican |
| Minimum | 10.0% | 1.1% |
| Maximum | 38.5% | 34.8% |
| Range | 28.5% | 33.7% |
| Mean | 18.3% | 15.5% |
| Median | 17.0% | 14.5% |
| Interquartile 25% (IQ1) | 14.7% | 11.6% |
| Interquartile 75% (IQ3) | 20.3% | 17.9% |
| Interquartile Range (IQR) | 5.6% | 6.3% |
| Standard Deviation (Sample) | 5.0% | 6.3% |
| Standard Deviation (Population) | 5.0% | 6.2% |
Similar Demographics by Female Poverty Among 25-34 Year Olds
Demographics Similar to Mexicans by Female Poverty Among 25-34 Year Olds
In terms of female poverty among 25-34 year olds, the demographic groups most similar to Mexicans are Immigrants from Central America (16.6%, a difference of 0.080%), Hispanic or Latino (16.6%, a difference of 0.20%), Immigrants from Guatemala (16.6%, a difference of 0.26%), Potawatomi (16.5%, a difference of 0.44%), and Immigrants from Dominica (16.5%, a difference of 0.71%).
| Demographics | Rating | Rank | Female Poverty Among 25-34 Year Olds |
| Guatemalans | 0.0 /100 | #288 | Tragic 16.4% |
| Osage | 0.0 /100 | #289 | Tragic 16.4% |
| Indonesians | 0.0 /100 | #290 | Tragic 16.4% |
| Comanche | 0.0 /100 | #291 | Tragic 16.5% |
| Immigrants | Dominica | 0.0 /100 | #292 | Tragic 16.5% |
| Potawatomi | 0.0 /100 | #293 | Tragic 16.5% |
| Immigrants | Central America | 0.0 /100 | #294 | Tragic 16.6% |
| Mexicans | 0.0 /100 | #295 | Tragic 16.6% |
| Hispanics or Latinos | 0.0 /100 | #296 | Tragic 16.6% |
| Immigrants | Guatemala | 0.0 /100 | #297 | Tragic 16.6% |
| Blackfeet | 0.0 /100 | #298 | Tragic 16.7% |
| Spanish Americans | 0.0 /100 | #299 | Tragic 16.7% |
| U.S. Virgin Islanders | 0.0 /100 | #300 | Tragic 16.7% |
| Immigrants | Congo | 0.0 /100 | #301 | Tragic 16.7% |
| Alaska Natives | 0.0 /100 | #302 | Tragic 16.8% |
Demographics Similar to Jamaicans by Female Poverty Among 25-34 Year Olds
In terms of female poverty among 25-34 year olds, the demographic groups most similar to Jamaicans are Immigrants from Middle Africa (14.8%, a difference of 0.040%), Immigrants from Nicaragua (14.8%, a difference of 0.22%), Immigrants from Bangladesh (14.8%, a difference of 0.22%), Scotch-Irish (14.8%, a difference of 0.26%), and Barbadian (14.8%, a difference of 0.26%).
| Demographics | Rating | Rank | Female Poverty Among 25-34 Year Olds |
| Malaysians | 1.4 /100 | #239 | Tragic 14.7% |
| Immigrants | Grenada | 1.3 /100 | #240 | Tragic 14.7% |
| Scotch-Irish | 1.2 /100 | #241 | Tragic 14.8% |
| Barbadians | 1.2 /100 | #242 | Tragic 14.8% |
| Immigrants | Nicaragua | 1.1 /100 | #243 | Tragic 14.8% |
| Immigrants | Bangladesh | 1.1 /100 | #244 | Tragic 14.8% |
| Immigrants | Middle Africa | 1.0 /100 | #245 | Tragic 14.8% |
| Jamaicans | 1.0 /100 | #246 | Tragic 14.8% |
| German Russians | 0.8 /100 | #247 | Tragic 14.9% |
| Immigrants | Western Africa | 0.8 /100 | #248 | Tragic 14.9% |
| Immigrants | Haiti | 0.5 /100 | #249 | Tragic 15.0% |
| Immigrants | El Salvador | 0.5 /100 | #250 | Tragic 15.0% |
| Haitians | 0.5 /100 | #251 | Tragic 15.0% |
| Belizeans | 0.4 /100 | #252 | Tragic 15.1% |
| Immigrants | West Indies | 0.4 /100 | #253 | Tragic 15.1% |