Yup'ik vs Kenyan Child Poverty Under the Age of 16

COMPARE

Yup'ik
Race
Ancestry
AfghanAfricanAlaska NativeAlaskan AthabascanAlbanianAleutAlsatianAmericanApacheArabArapahoArgentineanArmenianAssyrian/Chaldean/SyriacAustralianAustrianBahamianBangladeshiBarbadianBasqueBelgianBelizeanBermudanBhutaneseBlackfeetBolivianBrazilianBritishBritish West IndianBulgarianBurmeseCajunCambodianCanadianCape VerdeanCarpatho RusynCelticCentral AmericanCentral American IndianCherokeeCheyenneChickasawChileanChineseChippewaChoctawColombianColvilleComancheCosta RicanCreeCreekCroatianCrowCubanCypriotCzechCzechoslovakianDanishDelawareDominicanDutchDutch West IndianEastern EuropeanEcuadorianEgyptianEnglishEstonianEthiopianEuropeanFijianFilipinoFinnishFrenchFrench American IndianFrench CanadianGermanGerman RussianGhanaianGreekGuamanian/ChamorroGuatemalanGuyaneseHaitianHmongHonduranHopiHoumaHungarianIcelanderIndian (Asian)IndonesianInupiatIranianIraqiIrishIroquoisIsraeliItalianJamaicanJapaneseJordanianKiowaKoreanLaotianLatvianLebaneseLiberianLithuanianLumbeeLuxembourgerMacedonianMalaysianMalteseMarshalleseMenomineeMexicanMexican American IndianMongolianMoroccanNative HawaiianNavajoNepaleseNew ZealanderNicaraguanNigerianNorthern EuropeanNorwegianOkinawanOsageOttawaPaiutePakistaniPalestinianPanamanianParaguayanPennsylvania GermanPeruvianPimaPolishPortuguesePotawatomiPuebloPuerto RicanPuget Sound SalishRomanianRussianSalvadoranSamoanScandinavianScotch-IrishScottishSeminoleSenegaleseSerbianShoshoneSierra LeoneanSiouxSlavicSlovakSloveneSomaliSouth AfricanSouth AmericanSouth American IndianSoviet UnionSpaniardSpanishSpanish AmericanSpanish American IndianSri LankanSubsaharan AfricanSudaneseSwedishSwissSyrianTaiwaneseThaiTlingit-HaidaTohono O'OdhamTonganTrinidadian and TobagonianTsimshianTurkishU.S. Virgin IslanderUgandanUkrainianUruguayanUteVenezuelanVietnameseWelshWest IndianYakamaYaquiYugoslavianYumanYup'ikZimbabwean
Immigration
NonimmigrantsImmigrantsAfghanistanAfricaAlbaniaArgentinaArmeniaAsiaAustraliaAustriaBahamasBangladeshBarbadosBelarusBelgiumBelizeBoliviaBosnia and HerzegovinaBrazilBulgariaBurma/MyanmarCabo VerdeCambodiaCameroonCanadaCaribbeanCentral AmericaChileChinaColombiaCongoCosta RicaCroatiaCubaCzechoslovakiaDenmarkDominicaDominican RepublicEastern AfricaEastern AsiaEastern EuropeEcuadorEgyptEl SalvadorEnglandEritreaEthiopiaEuropeFijiFranceGermanyGhanaGreeceGrenadaGuatemalaGuyanaHaitiHondurasHong KongHungaryIndiaIndonesiaIranIraqIrelandIsraelItalyJamaicaJapanJordanKazakhstanKenyaKoreaKuwaitLaosLatin AmericaLatviaLebanonLiberiaLithuaniaMalaysiaMexicoMicronesiaMiddle AfricaMoldovaMoroccoNepalNetherlandsNicaraguaNigeriaNorth AmericaNorth MacedoniaNorthern AfricaNorthern EuropeNorwayOceaniaPakistanPanamaPeruPhilippinesPolandPortugalRomaniaRussiaSaudi ArabiaScotlandSenegalSerbiaSierra LeoneSingaporeSomaliaSouth AfricaSouth AmericaSouth Central AsiaSouth Eastern AsiaSouthern EuropeSpainSri LankaSt. Vincent and the GrenadinesSudanSwedenSwitzerlandSyriaTaiwanThailandTrinidad and TobagoTurkeyUgandaUkraineUruguayUzbekistanVenezuelaVietnamWest IndiesWestern AfricaWestern AsiaWestern EuropeYemenZaireZimbabweAzores
Kenyan
Race
Ancestry
AfghanAfricanAlaska NativeAlaskan AthabascanAlbanianAleutAlsatianAmericanApacheArabArapahoArgentineanArmenianAssyrian/Chaldean/SyriacAustralianAustrianBahamianBangladeshiBarbadianBasqueBelgianBelizeanBermudanBhutaneseBlackfeetBolivianBrazilianBritishBritish West IndianBulgarianBurmeseCajunCambodianCanadianCape VerdeanCarpatho RusynCelticCentral AmericanCentral American IndianCherokeeCheyenneChickasawChileanChineseChippewaChoctawColombianColvilleComancheCosta RicanCreeCreekCroatianCrowCubanCypriotCzechCzechoslovakianDanishDelawareDominicanDutchDutch West IndianEastern EuropeanEcuadorianEgyptianEnglishEstonianEthiopianEuropeanFijianFilipinoFinnishFrenchFrench American IndianFrench CanadianGermanGerman RussianGhanaianGreekGuamanian/ChamorroGuatemalanGuyaneseHaitianHmongHonduranHopiHoumaHungarianIcelanderIndian (Asian)IndonesianInupiatIranianIraqiIrishIroquoisIsraeliItalianJamaicanJapaneseJordanianKenyanKiowaKoreanLaotianLatvianLebaneseLiberianLithuanianLumbeeLuxembourgerMacedonianMalaysianMalteseMarshalleseMenomineeMexicanMexican American IndianMongolianMoroccanNative HawaiianNavajoNepaleseNew ZealanderNicaraguanNigerianNorthern EuropeanNorwegianOkinawanOsageOttawaPaiutePakistaniPalestinianPanamanianParaguayanPennsylvania GermanPeruvianPimaPolishPortuguesePotawatomiPuebloPuerto RicanPuget Sound SalishRomanianRussianSalvadoranSamoanScandinavianScotch-IrishScottishSeminoleSenegaleseSerbianShoshoneSierra LeoneanSiouxSlavicSlovakSloveneSomaliSouth AfricanSouth AmericanSouth American IndianSoviet UnionSpaniardSpanishSpanish AmericanSpanish American IndianSri LankanSubsaharan AfricanSudaneseSwedishSwissSyrianTaiwaneseThaiTlingit-HaidaTohono O'OdhamTonganTrinidadian and TobagonianTsimshianTurkishU.S. Virgin IslanderUgandanUkrainianUruguayanUteVenezuelanVietnameseWelshWest IndianYakamaYaquiYugoslavianYumanZimbabwean
Immigration
NonimmigrantsImmigrantsAfghanistanAfricaAlbaniaArgentinaArmeniaAsiaAustraliaAustriaBahamasBangladeshBarbadosBelarusBelgiumBelizeBoliviaBosnia and HerzegovinaBrazilBulgariaBurma/MyanmarCabo VerdeCambodiaCameroonCanadaCaribbeanCentral AmericaChileChinaColombiaCongoCosta RicaCroatiaCubaCzechoslovakiaDenmarkDominicaDominican RepublicEastern AfricaEastern AsiaEastern EuropeEcuadorEgyptEl SalvadorEnglandEritreaEthiopiaEuropeFijiFranceGermanyGhanaGreeceGrenadaGuatemalaGuyanaHaitiHondurasHong KongHungaryIndiaIndonesiaIranIraqIrelandIsraelItalyJamaicaJapanJordanKazakhstanKenyaKoreaKuwaitLaosLatin AmericaLatviaLebanonLiberiaLithuaniaMalaysiaMexicoMicronesiaMiddle AfricaMoldovaMoroccoNepalNetherlandsNicaraguaNigeriaNorth AmericaNorth MacedoniaNorthern AfricaNorthern EuropeNorwayOceaniaPakistanPanamaPeruPhilippinesPolandPortugalRomaniaRussiaSaudi ArabiaScotlandSenegalSerbiaSierra LeoneSingaporeSomaliaSouth AfricaSouth AmericaSouth Central AsiaSouth Eastern AsiaSouthern EuropeSpainSri LankaSt. Vincent and the GrenadinesSudanSwedenSwitzerlandSyriaTaiwanThailandTrinidad and TobagoTurkeyUgandaUkraineUruguayUzbekistanVenezuelaVietnamWest IndiesWestern AfricaWestern AsiaWestern EuropeYemenZaireZimbabweAzores
Child Poverty Under the Age of 16
Income
Poverty
Unemployment
Labor Participation
Family Structure
Vehicle Availability
Education Level
Disability

Child Poverty Under the Age of 16 Comparison

Yup'ik

Kenyans

Tragic
Fair
25.1%
CHILD POVERTY UNDER THE AGE OF 16
0.0/ 100
METRIC RATING
336th/ 347
METRIC RANK
16.5%
CHILD POVERTY UNDER THE AGE OF 16
34.1/ 100
METRIC RATING
186th/ 347
METRIC RANK

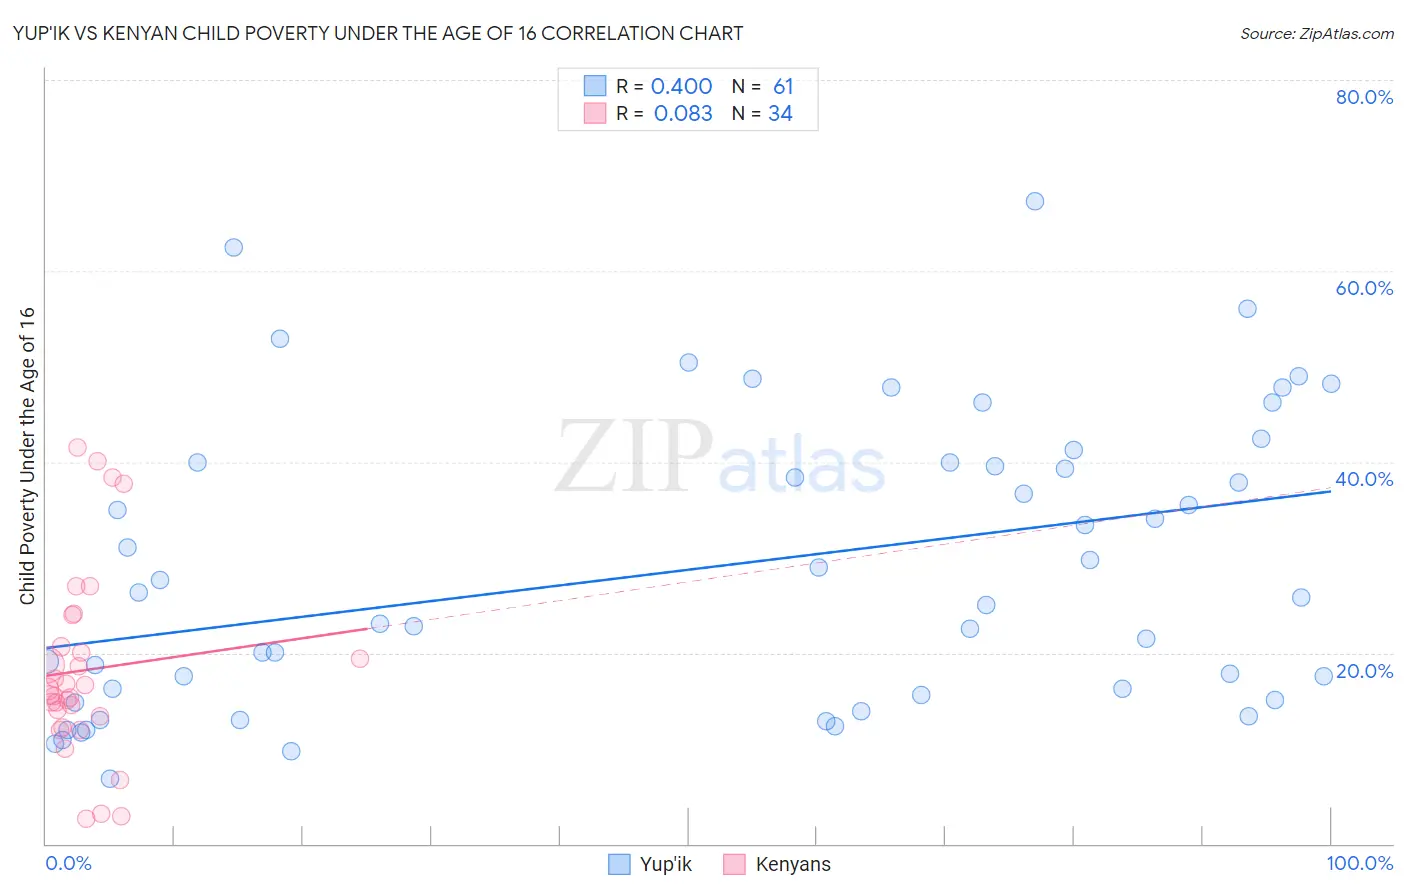
Yup'ik vs Kenyan Child Poverty Under the Age of 16 Correlation Chart

The statistical analysis conducted on geographies consisting of 39,914,814 people shows a mild positive correlation between the proportion of Yup'ik and poverty level among children under the age of 16 in the United States with a correlation coefficient (R) of 0.400 and weighted average of 25.1%. Similarly, the statistical analysis conducted on geographies consisting of 167,780,048 people shows a slight positive correlation between the proportion of Kenyans and poverty level among children under the age of 16 in the United States with a correlation coefficient (R) of 0.083 and weighted average of 16.5%, a difference of 52.0%.
Yup'ik vs Kenyan Child Poverty Under the Age of 16

Child Poverty Under the Age of 16 Correlation Summary

MeasurementYup'ikKenyan
Minimum6.8%2.6%
Maximum67.3%41.6%
Range60.5%38.9%
Mean28.9%18.2%
Median25.8%15.9%
Interquartile 25% (IQ1)15.3%13.4%
Interquartile 75% (IQ3)39.9%20.6%
Interquartile Range (IQR)24.6%7.2%
Standard Deviation (Sample)15.1%9.8%
Standard Deviation (Population)15.0%9.7%

Similar Demographics by Child Poverty Under the Age of 16

Demographics Similar to Yup'ik by Child Poverty Under the Age of 16

In terms of child poverty under the age of 16, the demographic groups most similar to Yup'ik are Sioux (25.2%, a difference of 0.37%), Cheyenne (25.4%, a difference of 1.0%), Houma (24.9%, a difference of 1.1%), Black/African American (24.4%, a difference of 2.8%), and Crow (26.0%, a difference of 3.3%).
DemographicsRating | RankChild Poverty Under the Age of 16
Dominicans
0.0
/100
|
#329
Tragic
23.8%
Natives/Alaskans
0.0
/100
|
#330
Tragic
23.8%
Apache
0.0
/100
|
#331
Tragic
23.8%
Pueblo
0.0
/100
|
#332
Tragic
23.9%
Immigrants | Dominican Republic
0.0
/100
|
#333
Tragic
24.0%
Blacks/African Americans
0.0
/100
|
#334
Tragic
24.4%
Houma
0.0
/100
|
#335
Tragic
24.9%
Yup'ik
0.0
/100
|
#336
Tragic
25.1%
Sioux
0.0
/100
|
#337
Tragic
25.2%
Cheyenne
0.0
/100
|
#338
Tragic
25.4%
Crow
0.0
/100
|
#339
Tragic
26.0%
Hopi
0.0
/100
|
#340
Tragic
27.1%
Yuman
0.0
/100
|
#341
Tragic
28.9%
Pima
0.0
/100
|
#342
Tragic
29.0%
Immigrants | Yemen
0.0
/100
|
#343
Tragic
29.1%

Demographics Similar to Kenyans by Child Poverty Under the Age of 16

In terms of child poverty under the age of 16, the demographic groups most similar to Kenyans are Arab (16.6%, a difference of 0.36%), Immigrants from Morocco (16.6%, a difference of 0.38%), Immigrants from Bosnia and Herzegovina (16.5%, a difference of 0.43%), Immigrants from Western Asia (16.4%, a difference of 0.50%), and Celtic (16.4%, a difference of 0.52%).
DemographicsRating | RankChild Poverty Under the Age of 16
Immigrants | Syria
42.3
/100
|
#179
Average
16.4%
South American Indians
41.8
/100
|
#180
Average
16.4%
Immigrants | South America
40.8
/100
|
#181
Average
16.4%
Hawaiians
38.2
/100
|
#182
Fair
16.4%
Celtics
38.2
/100
|
#183
Fair
16.4%
Immigrants | Western Asia
38.0
/100
|
#184
Fair
16.4%
Immigrants | Bosnia and Herzegovina
37.4
/100
|
#185
Fair
16.5%
Kenyans
34.1
/100
|
#186
Fair
16.5%
Arabs
31.4
/100
|
#187
Fair
16.6%
Immigrants | Morocco
31.2
/100
|
#188
Fair
16.6%
Immigrants | Portugal
30.0
/100
|
#189
Fair
16.6%
Immigrants | Costa Rica
29.6
/100
|
#190
Fair
16.6%
Immigrants | Iraq
28.3
/100
|
#191
Fair
16.7%
Spanish
24.5
/100
|
#192
Fair
16.7%
Spaniards
23.2
/100
|
#193
Fair
16.8%