Yuman vs Ethiopian Seniors Poverty Over the Age of 65
COMPARE
Yuman
Ethiopian
Seniors Poverty Over the Age of 65
Seniors Poverty Over the Age of 65 Comparison
Yuman
Ethiopians
13.1%
SENIORS POVERTY OVER THE AGE OF 65
0.0/ 100
METRIC RATING
280th/ 347
METRIC RANK
10.7%
SENIORS POVERTY OVER THE AGE OF 65
72.9/ 100
METRIC RATING
156th/ 347
METRIC RANK
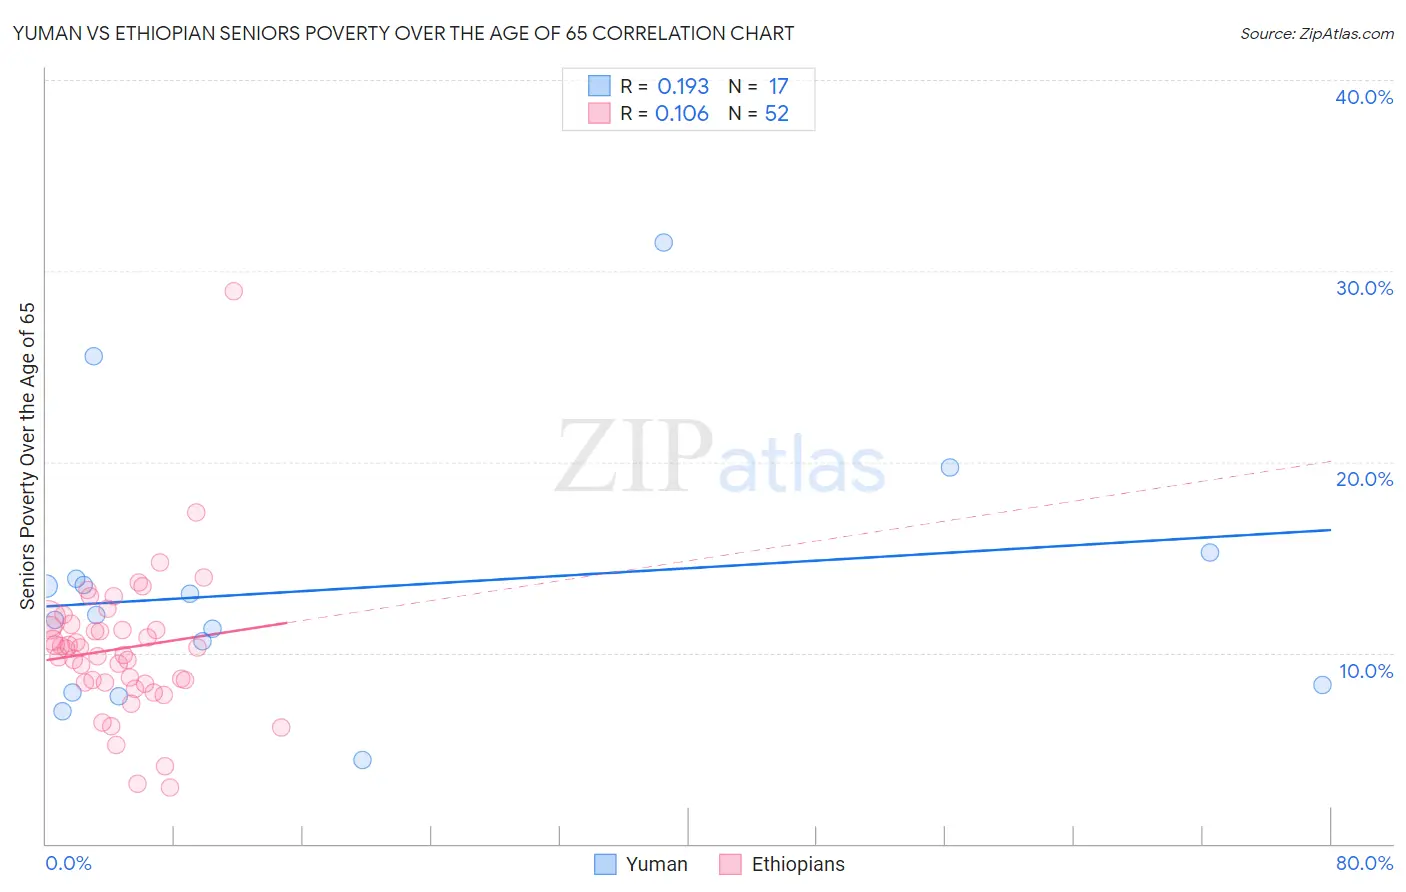
Yuman vs Ethiopian Seniors Poverty Over the Age of 65 Correlation Chart
The statistical analysis conducted on geographies consisting of 40,596,449 people shows a poor positive correlation between the proportion of Yuman and poverty level among seniors over the age of 65 in the United States with a correlation coefficient (R) of 0.193 and weighted average of 13.1%. Similarly, the statistical analysis conducted on geographies consisting of 222,742,361 people shows a poor positive correlation between the proportion of Ethiopians and poverty level among seniors over the age of 65 in the United States with a correlation coefficient (R) of 0.106 and weighted average of 10.7%, a difference of 22.3%.
Seniors Poverty Over the Age of 65 Correlation Summary
| Measurement | Yuman | Ethiopian |
| Minimum | 4.4% | 2.9% |
| Maximum | 31.5% | 28.9% |
| Range | 27.1% | 26.0% |
| Mean | 13.4% | 10.2% |
| Median | 12.0% | 10.3% |
| Interquartile 25% (IQ1) | 8.1% | 8.5% |
| Interquartile 75% (IQ3) | 14.6% | 11.4% |
| Interquartile Range (IQR) | 6.4% | 2.9% |
| Standard Deviation (Sample) | 6.8% | 3.9% |
| Standard Deviation (Population) | 6.6% | 3.8% |
Similar Demographics by Seniors Poverty Over the Age of 65
Demographics Similar to Yuman by Seniors Poverty Over the Age of 65
In terms of seniors poverty over the age of 65, the demographic groups most similar to Yuman are Mexican (13.1%, a difference of 0.040%), Immigrants from Bahamas (13.0%, a difference of 0.20%), Immigrants from El Salvador (13.1%, a difference of 0.44%), Paiute (12.9%, a difference of 1.0%), and Immigrants from the Azores (12.9%, a difference of 1.1%).
| Demographics | Rating | Rank | Seniors Poverty Over the Age of 65 |
| Kiowa | 0.0 /100 | #273 | Tragic 12.8% |
| Salvadorans | 0.0 /100 | #274 | Tragic 12.8% |
| Immigrants | Colombia | 0.0 /100 | #275 | Tragic 12.9% |
| Immigrants | Azores | 0.0 /100 | #276 | Tragic 12.9% |
| Paiute | 0.0 /100 | #277 | Tragic 12.9% |
| Immigrants | Bahamas | 0.0 /100 | #278 | Tragic 13.0% |
| Mexicans | 0.0 /100 | #279 | Tragic 13.1% |
| Yuman | 0.0 /100 | #280 | Tragic 13.1% |
| Immigrants | El Salvador | 0.0 /100 | #281 | Tragic 13.1% |
| Senegalese | 0.0 /100 | #282 | Tragic 13.3% |
| Central Americans | 0.0 /100 | #283 | Tragic 13.4% |
| Colville | 0.0 /100 | #284 | Tragic 13.5% |
| Guatemalans | 0.0 /100 | #285 | Tragic 13.5% |
| Immigrants | Senegal | 0.0 /100 | #286 | Tragic 13.6% |
| Immigrants | Mexico | 0.0 /100 | #287 | Tragic 13.6% |
Demographics Similar to Ethiopians by Seniors Poverty Over the Age of 65
In terms of seniors poverty over the age of 65, the demographic groups most similar to Ethiopians are Immigrants from Ethiopia (10.7%, a difference of 0.010%), Chickasaw (10.7%, a difference of 0.070%), Immigrants from Sierra Leone (10.7%, a difference of 0.15%), Immigrants from Saudi Arabia (10.7%, a difference of 0.23%), and Immigrants from Micronesia (10.7%, a difference of 0.24%).
| Demographics | Rating | Rank | Seniors Poverty Over the Age of 65 |
| Immigrants | Cameroon | 78.1 /100 | #149 | Good 10.6% |
| Immigrants | Switzerland | 77.3 /100 | #150 | Good 10.6% |
| Spanish | 76.8 /100 | #151 | Good 10.6% |
| Immigrants | Egypt | 76.5 /100 | #152 | Good 10.6% |
| Fijians | 75.6 /100 | #153 | Good 10.7% |
| Immigrants | Saudi Arabia | 74.9 /100 | #154 | Good 10.7% |
| Chickasaw | 73.6 /100 | #155 | Good 10.7% |
| Ethiopians | 72.9 /100 | #156 | Good 10.7% |
| Immigrants | Ethiopia | 72.9 /100 | #157 | Good 10.7% |
| Immigrants | Sierra Leone | 71.7 /100 | #158 | Good 10.7% |
| Immigrants | Micronesia | 70.8 /100 | #159 | Good 10.7% |
| Sudanese | 68.2 /100 | #160 | Good 10.7% |
| Arabs | 65.2 /100 | #161 | Good 10.8% |
| Immigrants | Indonesia | 64.8 /100 | #162 | Good 10.8% |
| Tsimshian | 64.5 /100 | #163 | Good 10.8% |