West Indian vs Basque Single Mother Poverty
COMPARE
West Indian
Basque
Single Mother Poverty
Single Mother Poverty Comparison
West Indians
Basques
30.8%
SINGLE MOTHER POVERTY
0.9/ 100
METRIC RATING
247th/ 347
METRIC RANK
29.5%
SINGLE MOTHER POVERTY
28.3/ 100
METRIC RATING
193rd/ 347
METRIC RANK
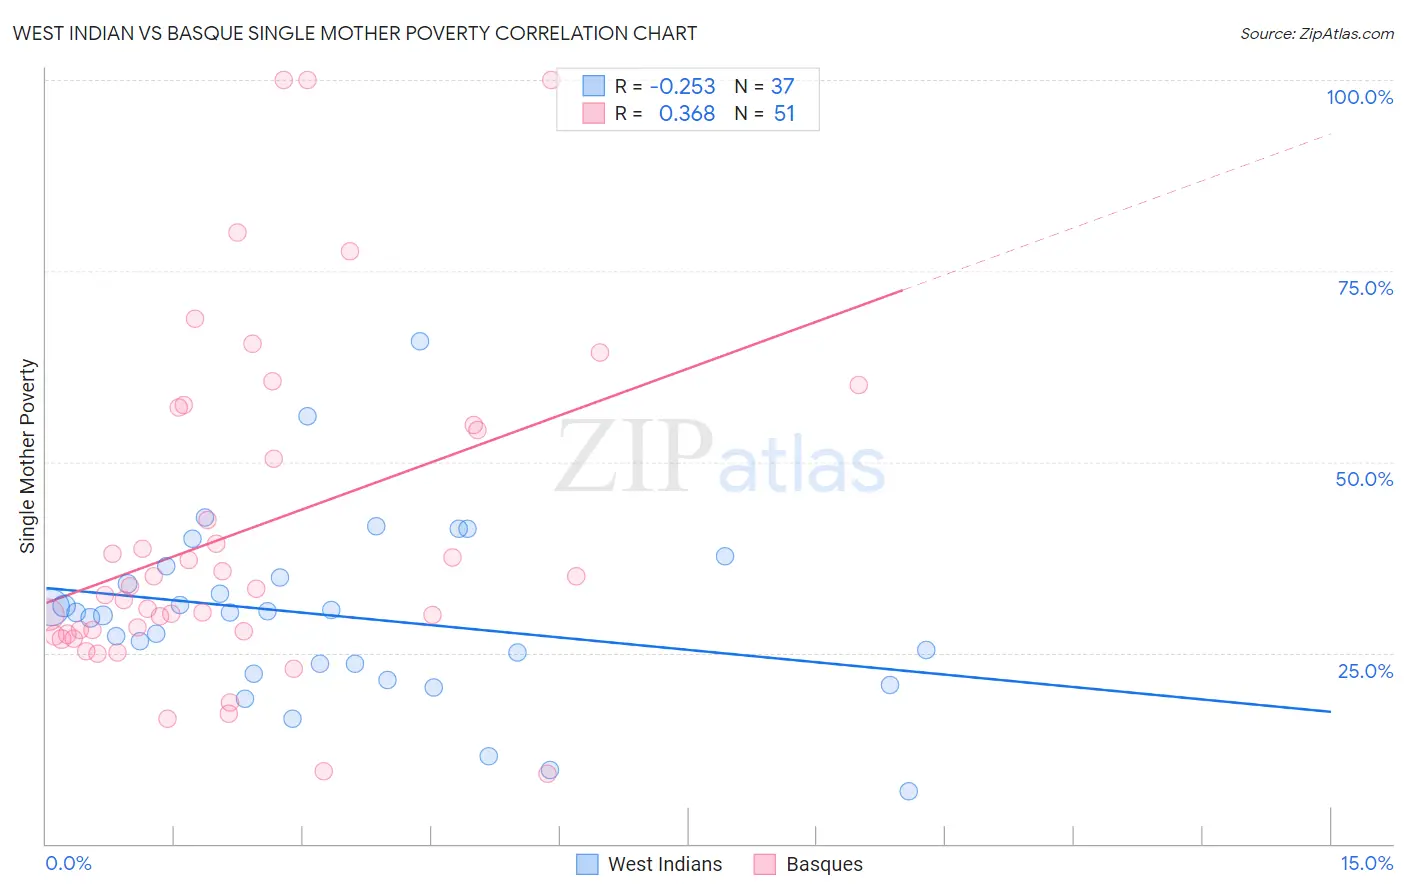
West Indian vs Basque Single Mother Poverty Correlation Chart
The statistical analysis conducted on geographies consisting of 250,715,566 people shows a weak negative correlation between the proportion of West Indians and poverty level among single mothers in the United States with a correlation coefficient (R) of -0.253 and weighted average of 30.8%. Similarly, the statistical analysis conducted on geographies consisting of 163,930,672 people shows a mild positive correlation between the proportion of Basques and poverty level among single mothers in the United States with a correlation coefficient (R) of 0.368 and weighted average of 29.5%, a difference of 4.4%.
Single Mother Poverty Correlation Summary
| Measurement | West Indian | Basque |
| Minimum | 6.9% | 9.1% |
| Maximum | 65.7% | 100.0% |
| Range | 58.8% | 90.9% |
| Mean | 29.9% | 41.0% |
| Median | 30.3% | 33.3% |
| Interquartile 25% (IQ1) | 22.9% | 27.4% |
| Interquartile 75% (IQ3) | 35.6% | 54.8% |
| Interquartile Range (IQR) | 12.7% | 27.3% |
| Standard Deviation (Sample) | 11.5% | 22.0% |
| Standard Deviation (Population) | 11.4% | 21.8% |
Similar Demographics by Single Mother Poverty
Demographics Similar to West Indians by Single Mother Poverty
In terms of single mother poverty, the demographic groups most similar to West Indians are Ecuadorian (30.8%, a difference of 0.040%), French Canadian (30.8%, a difference of 0.040%), Cape Verdean (30.8%, a difference of 0.12%), Vietnamese (30.9%, a difference of 0.26%), and Tlingit-Haida (30.9%, a difference of 0.39%).
| Demographics | Rating | Rank | Single Mother Poverty |
| Salvadorans | 1.8 /100 | #240 | Tragic 30.6% |
| Immigrants | Laos | 1.8 /100 | #241 | Tragic 30.6% |
| Immigrants | Burma/Myanmar | 1.7 /100 | #242 | Tragic 30.6% |
| Bermudans | 1.6 /100 | #243 | Tragic 30.6% |
| French | 1.3 /100 | #244 | Tragic 30.7% |
| Barbadians | 1.3 /100 | #245 | Tragic 30.7% |
| Ecuadorians | 0.9 /100 | #246 | Tragic 30.8% |
| West Indians | 0.9 /100 | #247 | Tragic 30.8% |
| French Canadians | 0.9 /100 | #248 | Tragic 30.8% |
| Cape Verdeans | 0.8 /100 | #249 | Tragic 30.8% |
| Vietnamese | 0.7 /100 | #250 | Tragic 30.9% |
| Tlingit-Haida | 0.6 /100 | #251 | Tragic 30.9% |
| Alaska Natives | 0.6 /100 | #252 | Tragic 30.9% |
| Celtics | 0.6 /100 | #253 | Tragic 30.9% |
| Senegalese | 0.5 /100 | #254 | Tragic 31.0% |
Demographics Similar to Basques by Single Mother Poverty
In terms of single mother poverty, the demographic groups most similar to Basques are Moroccan (29.5%, a difference of 0.020%), Immigrants from Trinidad and Tobago (29.5%, a difference of 0.050%), Immigrants from Germany (29.5%, a difference of 0.12%), Icelander (29.5%, a difference of 0.13%), and Immigrants from Africa (29.4%, a difference of 0.19%).
| Demographics | Rating | Rank | Single Mother Poverty |
| Yugoslavians | 36.0 /100 | #186 | Fair 29.4% |
| Lebanese | 32.5 /100 | #187 | Fair 29.4% |
| Guamanians/Chamorros | 31.8 /100 | #188 | Fair 29.4% |
| Immigrants | Africa | 31.6 /100 | #189 | Fair 29.4% |
| Immigrants | Germany | 30.4 /100 | #190 | Fair 29.5% |
| Immigrants | Trinidad and Tobago | 29.2 /100 | #191 | Fair 29.5% |
| Moroccans | 28.6 /100 | #192 | Fair 29.5% |
| Basques | 28.3 /100 | #193 | Fair 29.5% |
| Icelanders | 26.1 /100 | #194 | Fair 29.5% |
| Slavs | 24.5 /100 | #195 | Fair 29.6% |
| Spanish American Indians | 23.4 /100 | #196 | Fair 29.6% |
| Immigrants | Jamaica | 22.0 /100 | #197 | Fair 29.6% |
| Trinidadians and Tobagonians | 21.7 /100 | #198 | Fair 29.6% |
| Cubans | 20.8 /100 | #199 | Fair 29.6% |
| Panamanians | 20.0 /100 | #200 | Fair 29.6% |