Immigrants from Hungary vs Immigrants from Central America Seniors Poverty Over the Age of 65
COMPARE
Immigrants from Hungary
Immigrants from Central America
Seniors Poverty Over the Age of 65
Seniors Poverty Over the Age of 65 Comparison
Immigrants from Hungary
Immigrants from Central America
10.4%
SENIORS POVERTY OVER THE AGE OF 65
89.1/ 100
METRIC RATING
126th/ 347
METRIC RANK
13.6%
SENIORS POVERTY OVER THE AGE OF 65
0.0/ 100
METRIC RATING
290th/ 347
METRIC RANK
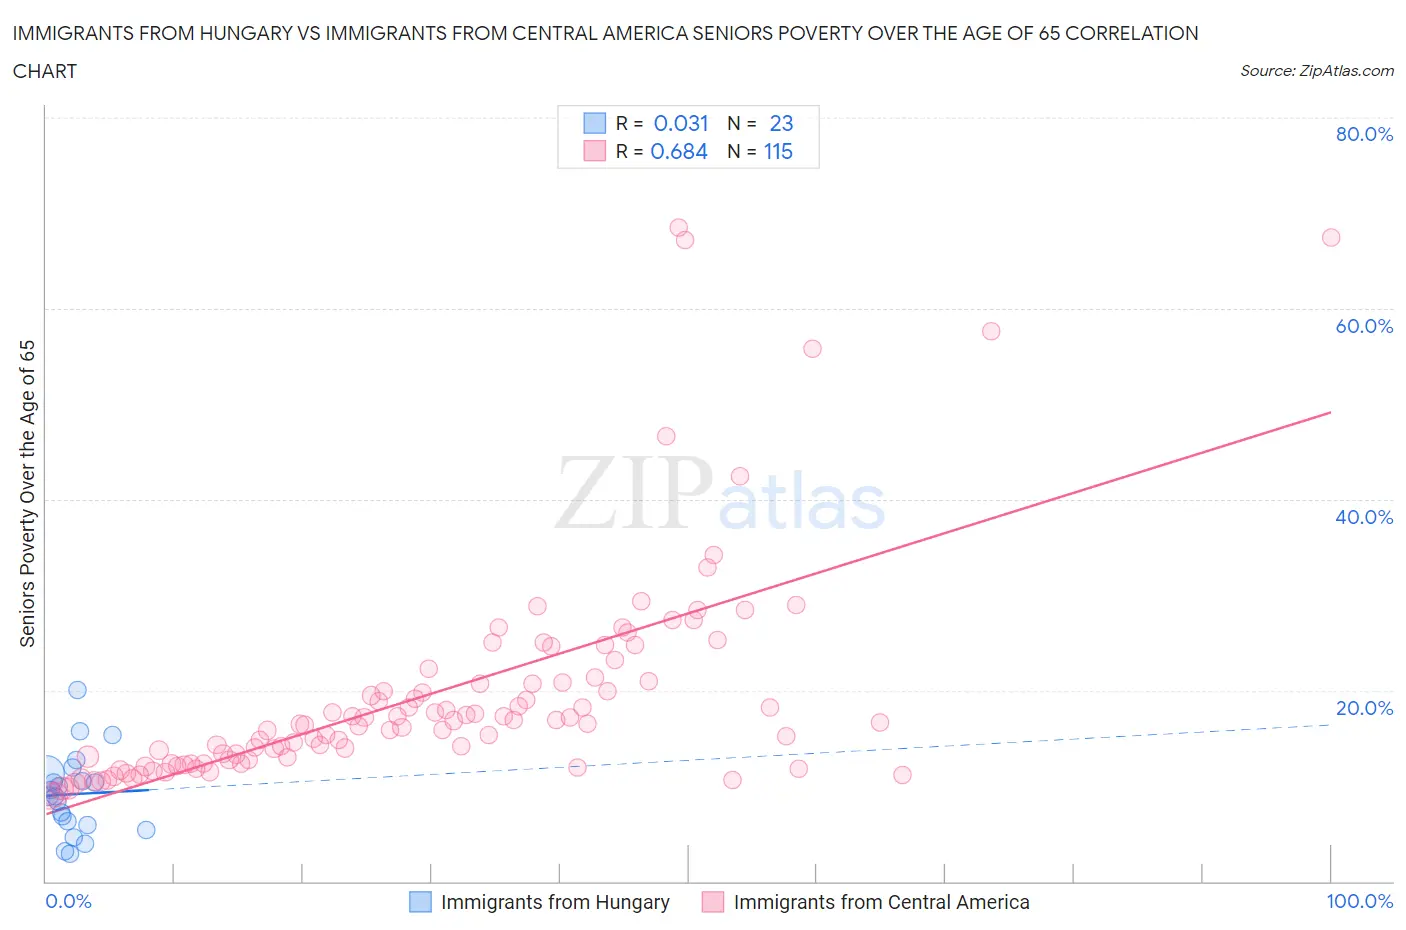
Immigrants from Hungary vs Immigrants from Central America Seniors Poverty Over the Age of 65 Correlation Chart
The statistical analysis conducted on geographies consisting of 195,507,188 people shows no correlation between the proportion of Immigrants from Hungary and poverty level among seniors over the age of 65 in the United States with a correlation coefficient (R) of 0.031 and weighted average of 10.4%. Similarly, the statistical analysis conducted on geographies consisting of 532,786,932 people shows a significant positive correlation between the proportion of Immigrants from Central America and poverty level among seniors over the age of 65 in the United States with a correlation coefficient (R) of 0.684 and weighted average of 13.6%, a difference of 30.8%.
Seniors Poverty Over the Age of 65 Correlation Summary
| Measurement | Immigrants from Hungary | Immigrants from Central America |
| Minimum | 2.9% | 8.9% |
| Maximum | 20.0% | 68.4% |
| Range | 17.1% | 59.5% |
| Mean | 9.1% | 19.6% |
| Median | 8.9% | 16.5% |
| Interquartile 25% (IQ1) | 5.9% | 12.3% |
| Interquartile 75% (IQ3) | 11.3% | 20.9% |
| Interquartile Range (IQR) | 5.4% | 8.6% |
| Standard Deviation (Sample) | 4.2% | 11.5% |
| Standard Deviation (Population) | 4.1% | 11.5% |
Similar Demographics by Seniors Poverty Over the Age of 65
Demographics Similar to Immigrants from Hungary by Seniors Poverty Over the Age of 65
In terms of seniors poverty over the age of 65, the demographic groups most similar to Immigrants from Hungary are Cambodian (10.4%, a difference of 0.0%), Immigrants from Philippines (10.4%, a difference of 0.070%), Ottawa (10.4%, a difference of 0.13%), Immigrants from Iran (10.4%, a difference of 0.15%), and Immigrants from Oceania (10.4%, a difference of 0.16%).
| Demographics | Rating | Rank | Seniors Poverty Over the Age of 65 |
| Immigrants | Western Europe | 91.1 /100 | #119 | Exceptional 10.4% |
| Immigrants | Bosnia and Herzegovina | 90.8 /100 | #120 | Exceptional 10.4% |
| Immigrants | Iraq | 90.7 /100 | #121 | Exceptional 10.4% |
| Immigrants | Moldova | 90.7 /100 | #122 | Exceptional 10.4% |
| Hmong | 90.0 /100 | #123 | Exceptional 10.4% |
| Asians | 89.9 /100 | #124 | Excellent 10.4% |
| Immigrants | Philippines | 89.4 /100 | #125 | Excellent 10.4% |
| Immigrants | Hungary | 89.1 /100 | #126 | Excellent 10.4% |
| Cambodians | 89.1 /100 | #127 | Excellent 10.4% |
| Ottawa | 88.5 /100 | #128 | Excellent 10.4% |
| Immigrants | Iran | 88.4 /100 | #129 | Excellent 10.4% |
| Immigrants | Oceania | 88.4 /100 | #130 | Excellent 10.4% |
| Egyptians | 87.8 /100 | #131 | Excellent 10.5% |
| Immigrants | Turkey | 87.7 /100 | #132 | Excellent 10.5% |
| Guamanians/Chamorros | 87.5 /100 | #133 | Excellent 10.5% |
Demographics Similar to Immigrants from Central America by Seniors Poverty Over the Age of 65
In terms of seniors poverty over the age of 65, the demographic groups most similar to Immigrants from Central America are Jamaican (13.6%, a difference of 0.0%), Belizean (13.6%, a difference of 0.27%), Immigrants from Mexico (13.6%, a difference of 0.41%), Black/African American (13.7%, a difference of 0.46%), and Immigrants from Senegal (13.6%, a difference of 0.53%).
| Demographics | Rating | Rank | Seniors Poverty Over the Age of 65 |
| Central Americans | 0.0 /100 | #283 | Tragic 13.4% |
| Colville | 0.0 /100 | #284 | Tragic 13.5% |
| Guatemalans | 0.0 /100 | #285 | Tragic 13.5% |
| Immigrants | Senegal | 0.0 /100 | #286 | Tragic 13.6% |
| Immigrants | Mexico | 0.0 /100 | #287 | Tragic 13.6% |
| Belizeans | 0.0 /100 | #288 | Tragic 13.6% |
| Jamaicans | 0.0 /100 | #289 | Tragic 13.6% |
| Immigrants | Central America | 0.0 /100 | #290 | Tragic 13.6% |
| Blacks/African Americans | 0.0 /100 | #291 | Tragic 13.7% |
| Spanish American Indians | 0.0 /100 | #292 | Tragic 13.8% |
| Immigrants | Guatemala | 0.0 /100 | #293 | Tragic 13.8% |
| Cheyenne | 0.0 /100 | #294 | Tragic 13.9% |
| Apache | 0.0 /100 | #295 | Tragic 13.9% |
| Immigrants | Jamaica | 0.0 /100 | #296 | Tragic 13.9% |
| Vietnamese | 0.0 /100 | #297 | Tragic 14.0% |