Cambodian vs German Female Poverty Among 25-34 Year Olds
COMPARE
Cambodian
German
Female Poverty Among 25-34 Year Olds
Female Poverty Among 25-34 Year Olds Comparison
Cambodians
Germans
11.7%
FEMALE POVERTY AMONG 25-34 YEAR OLDS
99.9/ 100
METRIC RATING
35th/ 347
METRIC RANK
13.6%
FEMALE POVERTY AMONG 25-34 YEAR OLDS
41.6/ 100
METRIC RATING
180th/ 347
METRIC RANK
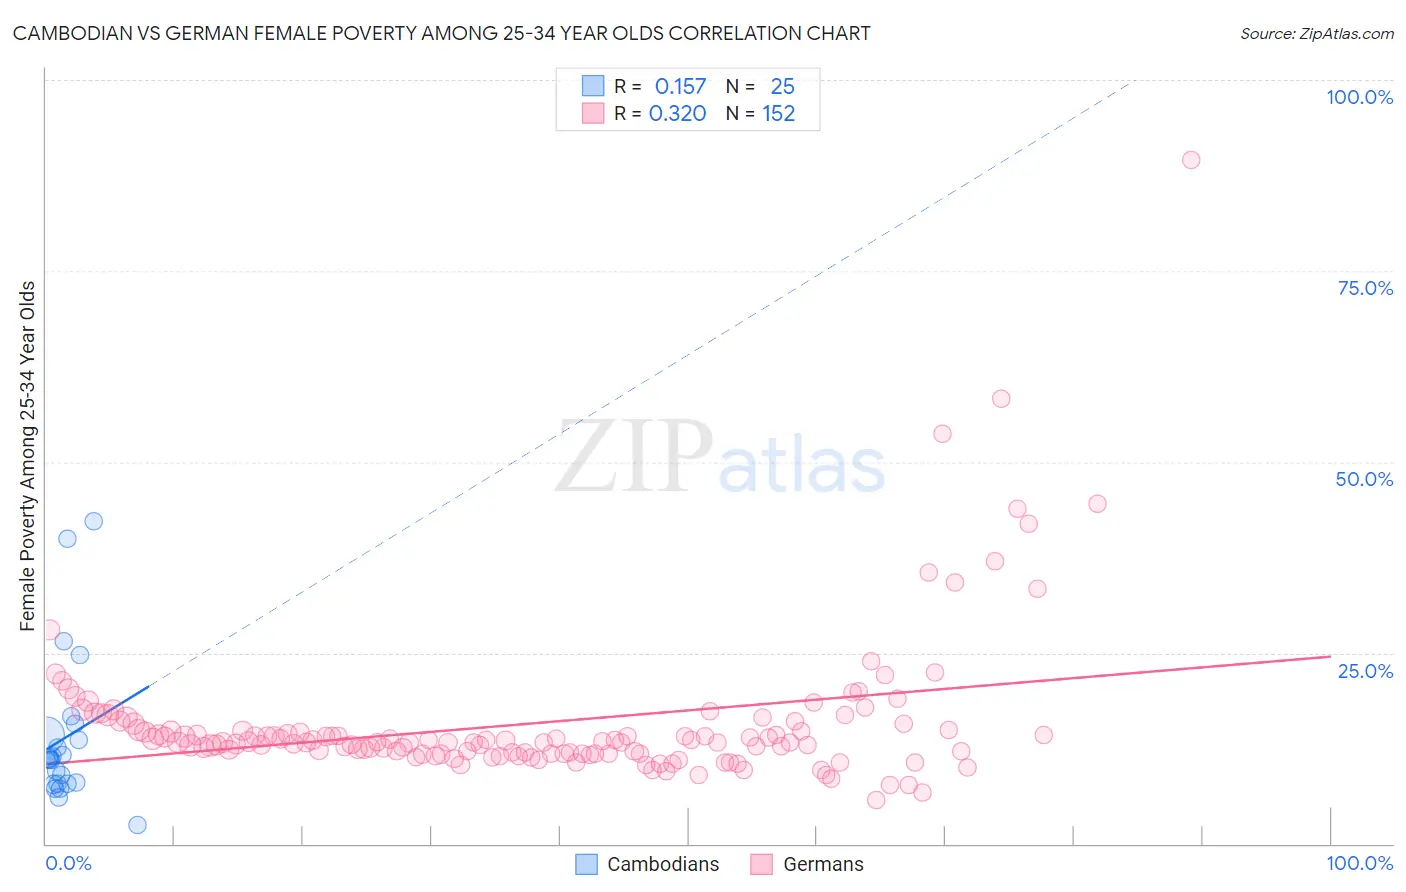
Cambodian vs German Female Poverty Among 25-34 Year Olds Correlation Chart
The statistical analysis conducted on geographies consisting of 102,197,555 people shows a poor positive correlation between the proportion of Cambodians and poverty level among females between the ages 25 and 34 in the United States with a correlation coefficient (R) of 0.157 and weighted average of 11.7%. Similarly, the statistical analysis conducted on geographies consisting of 555,866,490 people shows a mild positive correlation between the proportion of Germans and poverty level among females between the ages 25 and 34 in the United States with a correlation coefficient (R) of 0.320 and weighted average of 13.6%, a difference of 16.5%.
Female Poverty Among 25-34 Year Olds Correlation Summary
| Measurement | Cambodian | German |
| Minimum | 2.5% | 5.7% |
| Maximum | 42.2% | 89.5% |
| Range | 39.7% | 83.7% |
| Mean | 13.9% | 15.8% |
| Median | 11.1% | 13.3% |
| Interquartile 25% (IQ1) | 7.9% | 11.8% |
| Interquartile 75% (IQ3) | 14.9% | 14.9% |
| Interquartile Range (IQR) | 7.0% | 3.1% |
| Standard Deviation (Sample) | 9.8% | 9.9% |
| Standard Deviation (Population) | 9.6% | 9.8% |
Similar Demographics by Female Poverty Among 25-34 Year Olds
Demographics Similar to Cambodians by Female Poverty Among 25-34 Year Olds
In terms of female poverty among 25-34 year olds, the demographic groups most similar to Cambodians are Zimbabwean (11.7%, a difference of 0.27%), Immigrants from Poland (11.6%, a difference of 0.49%), Immigrants from Sri Lanka (11.8%, a difference of 0.49%), Taiwanese (11.8%, a difference of 0.65%), and Immigrants from North Macedonia (11.8%, a difference of 0.72%).
| Demographics | Rating | Rank | Female Poverty Among 25-34 Year Olds |
| Immigrants | Pakistan | 99.9 /100 | #28 | Exceptional 11.5% |
| Bulgarians | 99.9 /100 | #29 | Exceptional 11.5% |
| Cypriots | 99.9 /100 | #30 | Exceptional 11.5% |
| Immigrants | Japan | 99.9 /100 | #31 | Exceptional 11.6% |
| Immigrants | Asia | 99.9 /100 | #32 | Exceptional 11.6% |
| Immigrants | Poland | 99.9 /100 | #33 | Exceptional 11.6% |
| Zimbabweans | 99.9 /100 | #34 | Exceptional 11.7% |
| Cambodians | 99.9 /100 | #35 | Exceptional 11.7% |
| Immigrants | Sri Lanka | 99.8 /100 | #36 | Exceptional 11.8% |
| Taiwanese | 99.8 /100 | #37 | Exceptional 11.8% |
| Immigrants | North Macedonia | 99.8 /100 | #38 | Exceptional 11.8% |
| Latvians | 99.8 /100 | #39 | Exceptional 11.8% |
| Immigrants | Bulgaria | 99.8 /100 | #40 | Exceptional 11.8% |
| Immigrants | Indonesia | 99.8 /100 | #41 | Exceptional 11.8% |
| Immigrants | Turkey | 99.7 /100 | #42 | Exceptional 11.9% |
Demographics Similar to Germans by Female Poverty Among 25-34 Year Olds
In terms of female poverty among 25-34 year olds, the demographic groups most similar to Germans are Guamanian/Chamorro (13.6%, a difference of 0.010%), Immigrants from Venezuela (13.6%, a difference of 0.070%), Portuguese (13.6%, a difference of 0.11%), Immigrants from Eastern Africa (13.6%, a difference of 0.17%), and Canadian (13.6%, a difference of 0.23%).
| Demographics | Rating | Rank | Female Poverty Among 25-34 Year Olds |
| Kenyans | 51.8 /100 | #173 | Average 13.5% |
| Immigrants | Oceania | 50.0 /100 | #174 | Average 13.5% |
| Bermudans | 46.8 /100 | #175 | Average 13.6% |
| Yugoslavians | 45.0 /100 | #176 | Average 13.6% |
| Venezuelans | 44.6 /100 | #177 | Average 13.6% |
| Canadians | 44.3 /100 | #178 | Average 13.6% |
| Immigrants | Eastern Africa | 43.6 /100 | #179 | Average 13.6% |
| Germans | 41.6 /100 | #180 | Average 13.6% |
| Guamanians/Chamorros | 41.5 /100 | #181 | Average 13.6% |
| Immigrants | Venezuela | 40.7 /100 | #182 | Average 13.6% |
| Portuguese | 40.3 /100 | #183 | Average 13.6% |
| Czechoslovakians | 36.8 /100 | #184 | Fair 13.7% |
| Irish | 35.3 /100 | #185 | Fair 13.7% |
| Immigrants | Uruguay | 34.1 /100 | #186 | Fair 13.7% |
| Slovaks | 34.1 /100 | #187 | Fair 13.7% |