Immigrants from Panama vs Immigrants from Syria Female Poverty Among 18-24 Year Olds
COMPARE
Immigrants from Panama
Immigrants from Syria
Female Poverty Among 18-24 Year Olds
Female Poverty Among 18-24 Year Olds Comparison
Immigrants from Panama
Immigrants from Syria
19.4%
FEMALE POVERTY AMONG 18-24 YEAR OLDS
94.0/ 100
METRIC RATING
125th/ 347
METRIC RANK
19.2%
FEMALE POVERTY AMONG 18-24 YEAR OLDS
97.2/ 100
METRIC RATING
109th/ 347
METRIC RANK
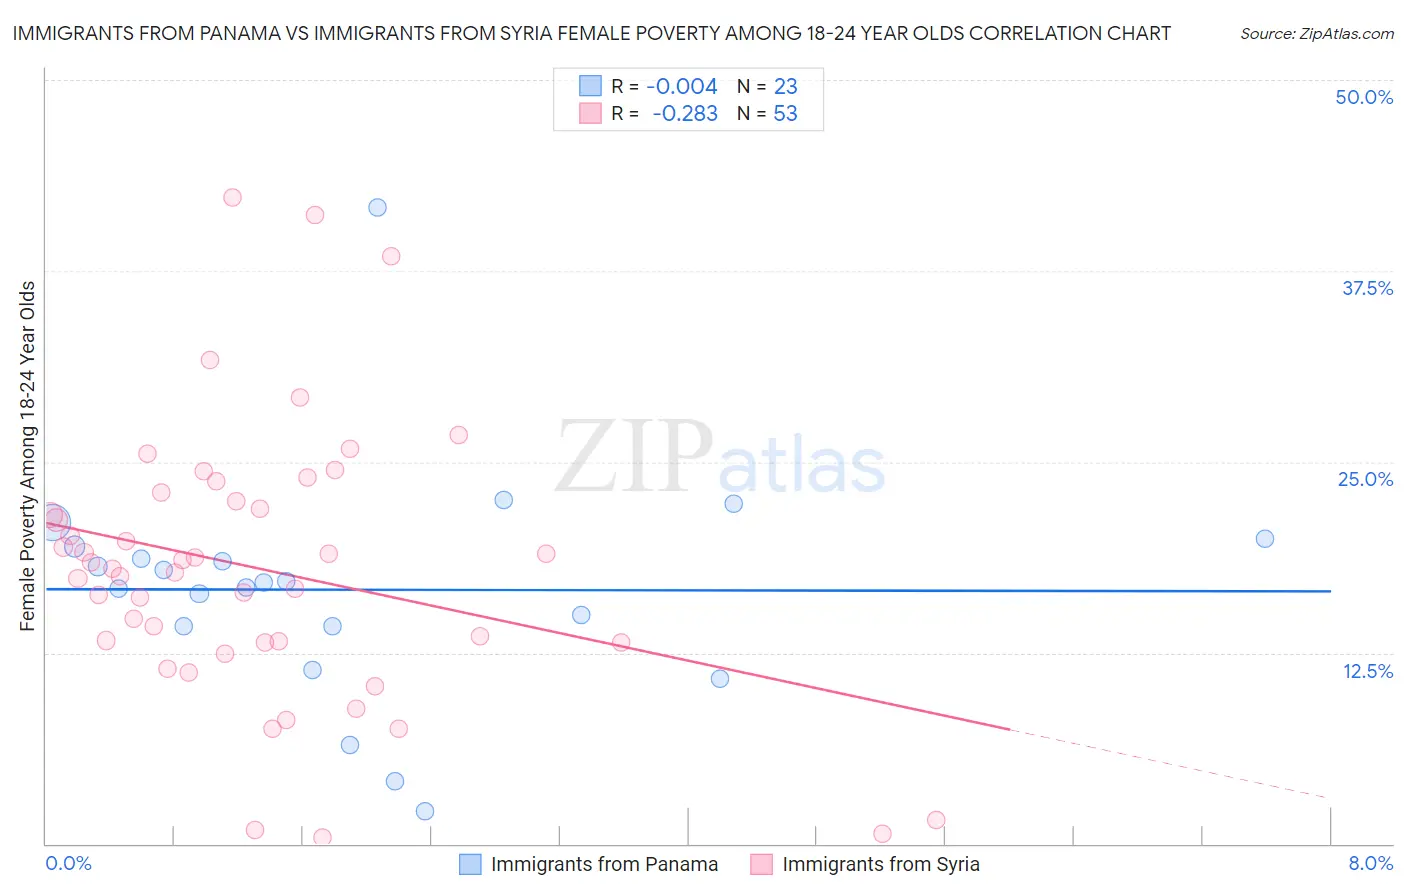
Immigrants from Panama vs Immigrants from Syria Female Poverty Among 18-24 Year Olds Correlation Chart
The statistical analysis conducted on geographies consisting of 218,726,886 people shows no correlation between the proportion of Immigrants from Panama and poverty level among females between the ages 18 and 24 in the United States with a correlation coefficient (R) of -0.004 and weighted average of 19.4%. Similarly, the statistical analysis conducted on geographies consisting of 172,353,428 people shows a weak negative correlation between the proportion of Immigrants from Syria and poverty level among females between the ages 18 and 24 in the United States with a correlation coefficient (R) of -0.283 and weighted average of 19.2%, a difference of 1.0%.
Female Poverty Among 18-24 Year Olds Correlation Summary
| Measurement | Immigrants from Panama | Immigrants from Syria |
| Minimum | 2.1% | 0.42% |
| Maximum | 41.7% | 42.3% |
| Range | 39.5% | 41.9% |
| Mean | 16.6% | 18.0% |
| Median | 17.1% | 18.0% |
| Interquartile 25% (IQ1) | 14.3% | 13.2% |
| Interquartile 75% (IQ3) | 19.5% | 22.7% |
| Interquartile Range (IQR) | 5.2% | 9.5% |
| Standard Deviation (Sample) | 7.7% | 9.0% |
| Standard Deviation (Population) | 7.5% | 8.9% |
Demographics Similar to Immigrants from Panama and Immigrants from Syria by Female Poverty Among 18-24 Year Olds
In terms of female poverty among 18-24 year olds, the demographic groups most similar to Immigrants from Panama are Immigrants from Chile (19.4%, a difference of 0.060%), Immigrants from Russia (19.4%, a difference of 0.060%), Cape Verdean (19.4%, a difference of 0.080%), Paraguayan (19.4%, a difference of 0.13%), and Cambodian (19.4%, a difference of 0.14%). Similarly, the demographic groups most similar to Immigrants from Syria are Laotian (19.2%, a difference of 0.030%), Immigrants from Serbia (19.2%, a difference of 0.040%), Immigrants from Uzbekistan (19.2%, a difference of 0.080%), Immigrants from Sri Lanka (19.2%, a difference of 0.17%), and Immigrants from El Salvador (19.3%, a difference of 0.27%).
| Demographics | Rating | Rank | Female Poverty Among 18-24 Year Olds |
| Immigrants | Sri Lanka | 97.5 /100 | #107 | Exceptional 19.2% |
| Immigrants | Uzbekistan | 97.3 /100 | #108 | Exceptional 19.2% |
| Immigrants | Syria | 97.2 /100 | #109 | Exceptional 19.2% |
| Laotians | 97.1 /100 | #110 | Exceptional 19.2% |
| Immigrants | Serbia | 97.1 /100 | #111 | Exceptional 19.2% |
| Immigrants | El Salvador | 96.5 /100 | #112 | Exceptional 19.3% |
| Immigrants | Cameroon | 96.3 /100 | #113 | Exceptional 19.3% |
| Slovenes | 96.2 /100 | #114 | Exceptional 19.3% |
| Immigrants | Hungary | 96.2 /100 | #115 | Exceptional 19.3% |
| Immigrants | Immigrants | 95.9 /100 | #116 | Exceptional 19.3% |
| Immigrants | Iran | 95.8 /100 | #117 | Exceptional 19.3% |
| Immigrants | Guyana | 95.6 /100 | #118 | Exceptional 19.3% |
| Cypriots | 95.5 /100 | #119 | Exceptional 19.3% |
| Immigrants | Northern Europe | 95.4 /100 | #120 | Exceptional 19.4% |
| Guyanese | 95.3 /100 | #121 | Exceptional 19.4% |
| Cambodians | 94.6 /100 | #122 | Exceptional 19.4% |
| Paraguayans | 94.6 /100 | #123 | Exceptional 19.4% |
| Immigrants | Chile | 94.3 /100 | #124 | Exceptional 19.4% |
| Immigrants | Panama | 94.0 /100 | #125 | Exceptional 19.4% |
| Immigrants | Russia | 93.7 /100 | #126 | Exceptional 19.4% |
| Cape Verdeans | 93.6 /100 | #127 | Exceptional 19.4% |