Immigrants from Peru vs Colville Child Poverty Under the Age of 16
COMPARE
Immigrants from Peru
Colville
Child Poverty Under the Age of 16
Child Poverty Under the Age of 16 Comparison
Immigrants from Peru
Colville
15.5%
CHILD POVERTY UNDER THE AGE OF 16
81.7/ 100
METRIC RATING
145th/ 347
METRIC RANK
23.0%
CHILD POVERTY UNDER THE AGE OF 16
0.0/ 100
METRIC RATING
328th/ 347
METRIC RANK
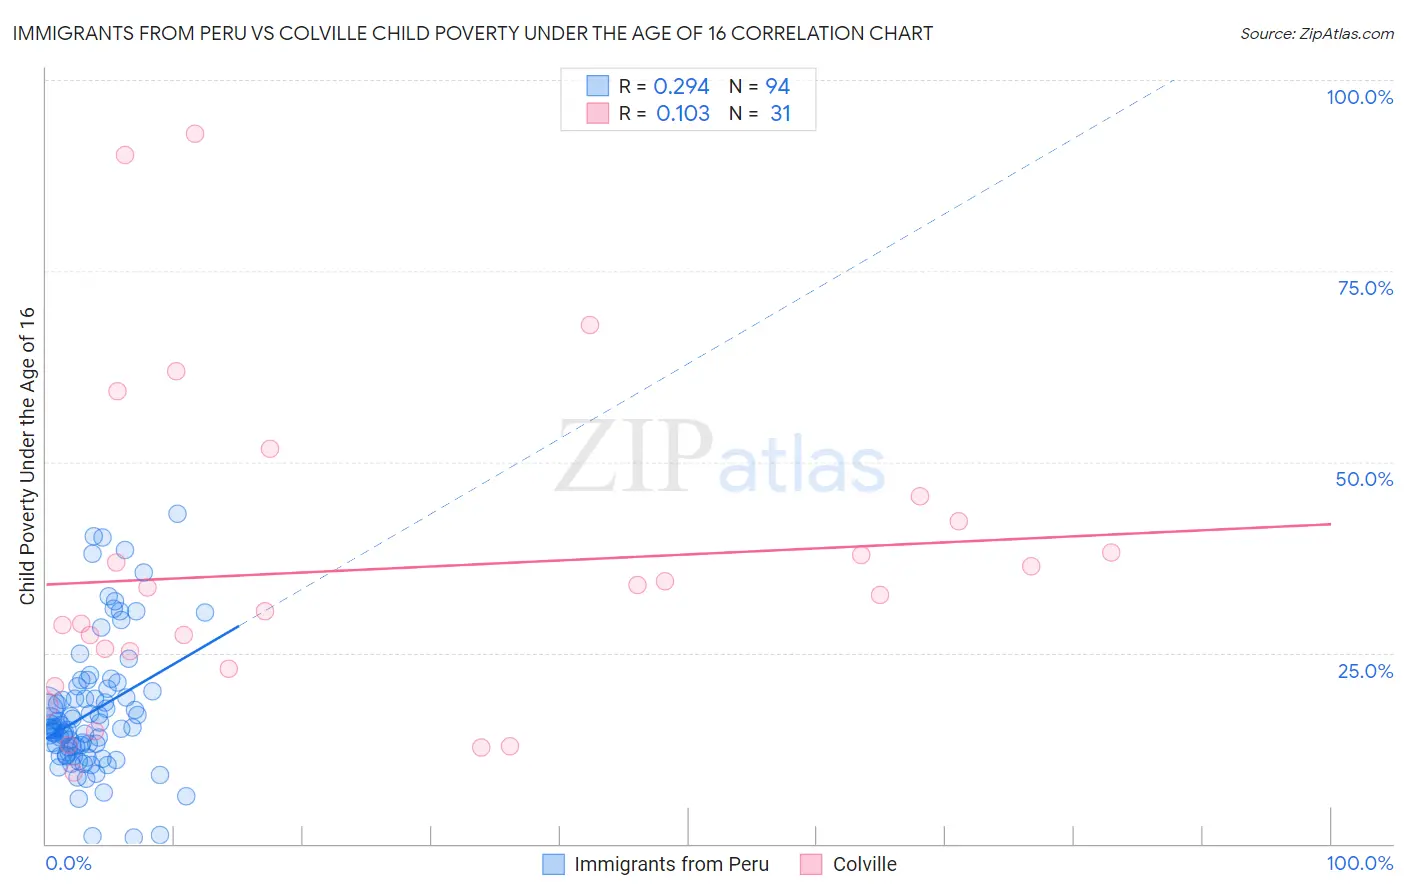
Immigrants from Peru vs Colville Child Poverty Under the Age of 16 Correlation Chart
The statistical analysis conducted on geographies consisting of 326,777,909 people shows a weak positive correlation between the proportion of Immigrants from Peru and poverty level among children under the age of 16 in the United States with a correlation coefficient (R) of 0.294 and weighted average of 15.5%. Similarly, the statistical analysis conducted on geographies consisting of 34,640,964 people shows a poor positive correlation between the proportion of Colville and poverty level among children under the age of 16 in the United States with a correlation coefficient (R) of 0.103 and weighted average of 23.0%, a difference of 48.9%.
Child Poverty Under the Age of 16 Correlation Summary
| Measurement | Immigrants from Peru | Colville |
| Minimum | 0.80% | 9.3% |
| Maximum | 43.1% | 93.0% |
| Range | 42.3% | 83.7% |
| Mean | 17.3% | 35.9% |
| Median | 15.1% | 32.6% |
| Interquartile 25% (IQ1) | 12.0% | 23.0% |
| Interquartile 75% (IQ3) | 20.0% | 42.3% |
| Interquartile Range (IQR) | 8.0% | 19.3% |
| Standard Deviation (Sample) | 8.6% | 20.7% |
| Standard Deviation (Population) | 8.6% | 20.4% |
Similar Demographics by Child Poverty Under the Age of 16
Demographics Similar to Immigrants from Peru by Child Poverty Under the Age of 16
In terms of child poverty under the age of 16, the demographic groups most similar to Immigrants from Peru are Slovak (15.5%, a difference of 0.040%), Immigrants from Hungary (15.5%, a difference of 0.050%), Icelander (15.4%, a difference of 0.17%), Brazilian (15.4%, a difference of 0.24%), and Immigrants from Kuwait (15.5%, a difference of 0.24%).
| Demographics | Rating | Rank | Child Poverty Under the Age of 16 |
| Welsh | 87.2 /100 | #138 | Excellent 15.3% |
| Immigrants | Vietnam | 87.1 /100 | #139 | Excellent 15.3% |
| New Zealanders | 86.9 /100 | #140 | Excellent 15.3% |
| Slavs | 84.2 /100 | #141 | Excellent 15.4% |
| Brazilians | 82.8 /100 | #142 | Excellent 15.4% |
| Icelanders | 82.5 /100 | #143 | Excellent 15.4% |
| Immigrants | Hungary | 81.9 /100 | #144 | Excellent 15.5% |
| Immigrants | Peru | 81.7 /100 | #145 | Excellent 15.5% |
| Slovaks | 81.4 /100 | #146 | Excellent 15.5% |
| Immigrants | Kuwait | 80.5 /100 | #147 | Excellent 15.5% |
| Puget Sound Salish | 80.3 /100 | #148 | Excellent 15.5% |
| Israelis | 80.1 /100 | #149 | Excellent 15.5% |
| Immigrants | Jordan | 78.5 /100 | #150 | Good 15.6% |
| French | 78.5 /100 | #151 | Good 15.6% |
| French Canadians | 78.2 /100 | #152 | Good 15.6% |
Demographics Similar to Colville by Child Poverty Under the Age of 16
In terms of child poverty under the age of 16, the demographic groups most similar to Colville are Menominee (23.0%, a difference of 0.38%), Immigrants from Honduras (22.7%, a difference of 1.5%), Immigrants from Congo (22.5%, a difference of 2.3%), Central American Indian (22.5%, a difference of 2.5%), and Paiute (22.4%, a difference of 2.8%).
| Demographics | Rating | Rank | Child Poverty Under the Age of 16 |
| Kiowa | 0.0 /100 | #321 | Tragic 22.2% |
| Hondurans | 0.0 /100 | #322 | Tragic 22.2% |
| Paiute | 0.0 /100 | #323 | Tragic 22.4% |
| Central American Indians | 0.0 /100 | #324 | Tragic 22.5% |
| Immigrants | Congo | 0.0 /100 | #325 | Tragic 22.5% |
| Immigrants | Honduras | 0.0 /100 | #326 | Tragic 22.7% |
| Menominee | 0.0 /100 | #327 | Tragic 23.0% |
| Colville | 0.0 /100 | #328 | Tragic 23.0% |
| Dominicans | 0.0 /100 | #329 | Tragic 23.8% |
| Natives/Alaskans | 0.0 /100 | #330 | Tragic 23.8% |
| Apache | 0.0 /100 | #331 | Tragic 23.8% |
| Pueblo | 0.0 /100 | #332 | Tragic 23.9% |
| Immigrants | Dominican Republic | 0.0 /100 | #333 | Tragic 24.0% |
| Blacks/African Americans | 0.0 /100 | #334 | Tragic 24.4% |
| Houma | 0.0 /100 | #335 | Tragic 24.9% |