Taiwanese vs Immigrants from Korea Seniors Poverty Over the Age of 75
COMPARE
Taiwanese
Immigrants from Korea
Seniors Poverty Over the Age of 75
Seniors Poverty Over the Age of 75 Comparison
Taiwanese
Immigrants from Korea
12.6%
SENIORS POVERTY OVER THE AGE OF 75
17.8/ 100
METRIC RATING
193rd/ 347
METRIC RANK
12.0%
SENIORS POVERTY OVER THE AGE OF 75
65.5/ 100
METRIC RATING
152nd/ 347
METRIC RANK
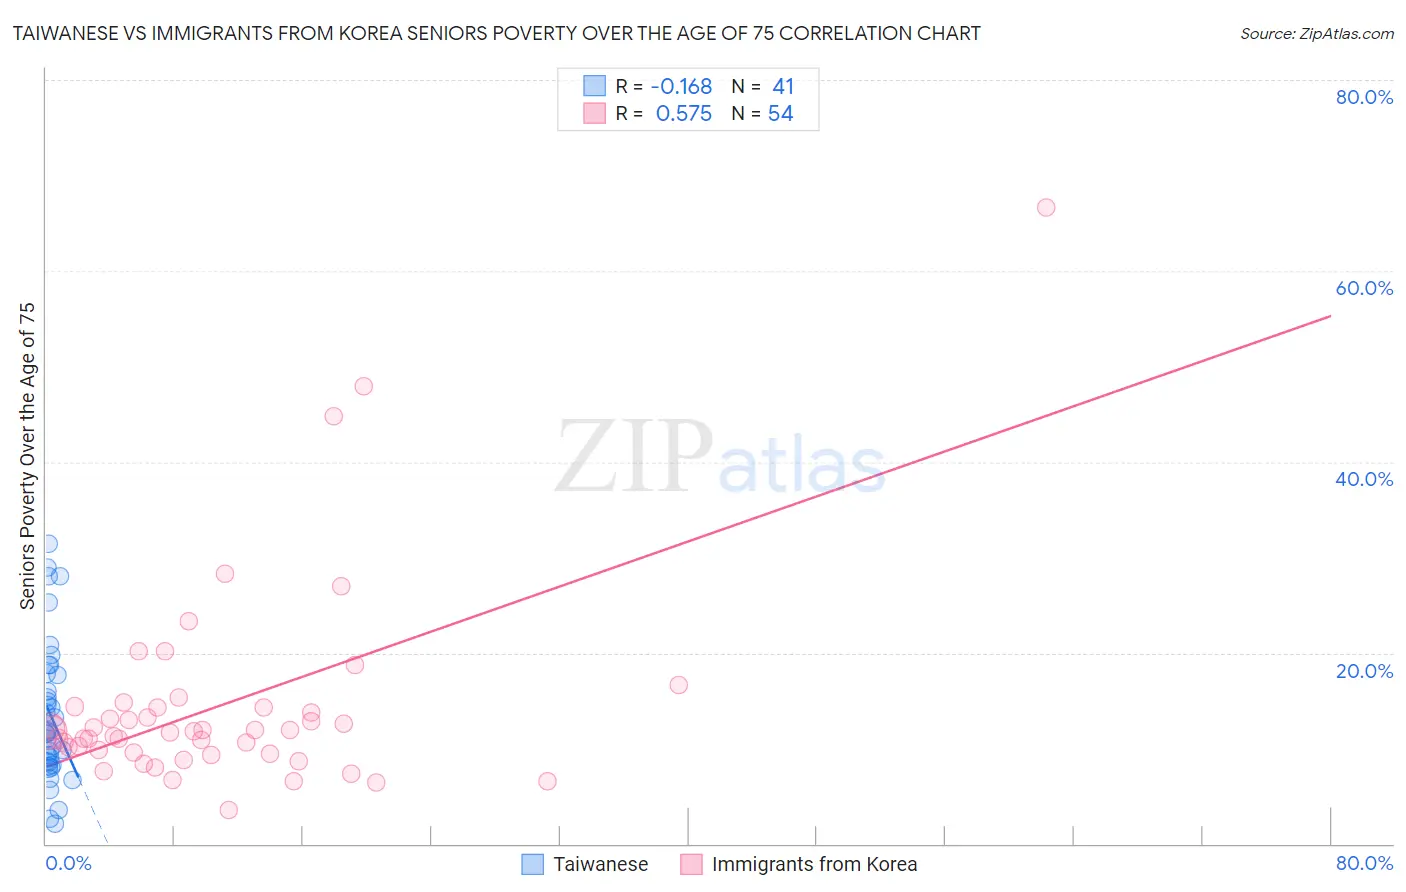
Taiwanese vs Immigrants from Korea Seniors Poverty Over the Age of 75 Correlation Chart
The statistical analysis conducted on geographies consisting of 31,695,905 people shows a poor negative correlation between the proportion of Taiwanese and poverty level among seniors over the age of 75 in the United States with a correlation coefficient (R) of -0.168 and weighted average of 12.6%. Similarly, the statistical analysis conducted on geographies consisting of 410,560,504 people shows a substantial positive correlation between the proportion of Immigrants from Korea and poverty level among seniors over the age of 75 in the United States with a correlation coefficient (R) of 0.575 and weighted average of 12.0%, a difference of 4.5%.
Seniors Poverty Over the Age of 75 Correlation Summary
| Measurement | Taiwanese | Immigrants from Korea |
| Minimum | 2.1% | 3.6% |
| Maximum | 31.5% | 66.7% |
| Range | 29.3% | 63.1% |
| Mean | 13.5% | 14.5% |
| Median | 11.7% | 11.8% |
| Interquartile 25% (IQ1) | 8.4% | 9.6% |
| Interquartile 75% (IQ3) | 17.8% | 14.3% |
| Interquartile Range (IQR) | 9.4% | 4.7% |
| Standard Deviation (Sample) | 7.2% | 10.8% |
| Standard Deviation (Population) | 7.1% | 10.7% |
Similar Demographics by Seniors Poverty Over the Age of 75
Demographics Similar to Taiwanese by Seniors Poverty Over the Age of 75
In terms of seniors poverty over the age of 75, the demographic groups most similar to Taiwanese are Alsatian (12.6%, a difference of 0.010%), Immigrants from France (12.6%, a difference of 0.060%), Immigrants from Eastern Europe (12.6%, a difference of 0.24%), Choctaw (12.5%, a difference of 0.31%), and Nepalese (12.6%, a difference of 0.50%).
| Demographics | Rating | Rank | Seniors Poverty Over the Age of 75 |
| Sri Lankans | 32.3 /100 | #186 | Fair 12.4% |
| Yaqui | 25.9 /100 | #187 | Fair 12.5% |
| Immigrants | Northern Africa | 25.2 /100 | #188 | Fair 12.5% |
| Immigrants | Indonesia | 24.4 /100 | #189 | Fair 12.5% |
| Immigrants | Congo | 23.9 /100 | #190 | Fair 12.5% |
| Liberians | 23.2 /100 | #191 | Fair 12.5% |
| Choctaw | 20.2 /100 | #192 | Fair 12.5% |
| Taiwanese | 17.8 /100 | #193 | Poor 12.6% |
| Alsatians | 17.7 /100 | #194 | Poor 12.6% |
| Immigrants | France | 17.4 /100 | #195 | Poor 12.6% |
| Immigrants | Eastern Europe | 16.0 /100 | #196 | Poor 12.6% |
| Nepalese | 14.4 /100 | #197 | Poor 12.6% |
| Chileans | 13.7 /100 | #198 | Poor 12.6% |
| Immigrants | Lebanon | 12.7 /100 | #199 | Poor 12.7% |
| Immigrants | Vietnam | 12.1 /100 | #200 | Poor 12.7% |
Demographics Similar to Immigrants from Korea by Seniors Poverty Over the Age of 75
In terms of seniors poverty over the age of 75, the demographic groups most similar to Immigrants from Korea are Cherokee (12.0%, a difference of 0.030%), Immigrants from Turkey (12.0%, a difference of 0.080%), Cambodian (12.0%, a difference of 0.14%), Cypriot (12.0%, a difference of 0.17%), and Asian (12.0%, a difference of 0.18%).
| Demographics | Rating | Rank | Seniors Poverty Over the Age of 75 |
| Immigrants | Belgium | 70.8 /100 | #145 | Good 12.0% |
| Bangladeshis | 70.4 /100 | #146 | Good 12.0% |
| Immigrants | Latvia | 69.1 /100 | #147 | Good 12.0% |
| Immigrants | Zaire | 67.6 /100 | #148 | Good 12.0% |
| Asians | 67.4 /100 | #149 | Good 12.0% |
| Cypriots | 67.3 /100 | #150 | Good 12.0% |
| Cherokee | 65.8 /100 | #151 | Good 12.0% |
| Immigrants | Korea | 65.5 /100 | #152 | Good 12.0% |
| Immigrants | Turkey | 64.7 /100 | #153 | Good 12.0% |
| Cambodians | 64.0 /100 | #154 | Good 12.0% |
| Indonesians | 62.6 /100 | #155 | Good 12.1% |
| Immigrants | Burma/Myanmar | 62.3 /100 | #156 | Good 12.1% |
| Immigrants | Sudan | 61.7 /100 | #157 | Good 12.1% |
| Portuguese | 61.3 /100 | #158 | Good 12.1% |
| Immigrants | Middle Africa | 61.2 /100 | #159 | Good 12.1% |