Uruguayan vs Icelander Child Poverty Under the Age of 16

COMPARE

Uruguayan
Race
Ancestry
AfghanAfricanAlaska NativeAlaskan AthabascanAlbanianAleutAlsatianAmericanApacheArabArapahoArgentineanArmenianAssyrian/Chaldean/SyriacAustralianAustrianBahamianBangladeshiBarbadianBasqueBelgianBelizeanBermudanBhutaneseBlackfeetBolivianBrazilianBritishBritish West IndianBulgarianBurmeseCajunCambodianCanadianCape VerdeanCarpatho RusynCelticCentral AmericanCentral American IndianCherokeeCheyenneChickasawChileanChineseChippewaChoctawColombianColvilleComancheCosta RicanCreeCreekCroatianCrowCubanCypriotCzechCzechoslovakianDanishDelawareDominicanDutchDutch West IndianEastern EuropeanEcuadorianEgyptianEnglishEstonianEthiopianEuropeanFijianFilipinoFinnishFrenchFrench American IndianFrench CanadianGermanGerman RussianGhanaianGreekGuamanian/ChamorroGuatemalanGuyaneseHaitianHmongHonduranHopiHoumaHungarianIndian (Asian)IndonesianInupiatIranianIraqiIrishIroquoisIsraeliItalianJamaicanJapaneseJordanianKenyanKiowaKoreanLaotianLatvianLebaneseLiberianLithuanianLumbeeLuxembourgerMacedonianMalaysianMalteseMarshalleseMenomineeMexicanMexican American IndianMongolianMoroccanNative HawaiianNavajoNepaleseNew ZealanderNicaraguanNigerianNorthern EuropeanNorwegianOkinawanOsageOttawaPaiutePakistaniPalestinianPanamanianParaguayanPennsylvania GermanPeruvianPimaPolishPortuguesePotawatomiPuebloPuerto RicanPuget Sound SalishRomanianRussianSalvadoranSamoanScandinavianScotch-IrishScottishSeminoleSenegaleseSerbianShoshoneSierra LeoneanSiouxSlavicSlovakSloveneSomaliSouth AfricanSouth AmericanSouth American IndianSoviet UnionSpaniardSpanishSpanish AmericanSpanish American IndianSri LankanSubsaharan AfricanSudaneseSwedishSwissSyrianTaiwaneseThaiTlingit-HaidaTohono O'OdhamTonganTrinidadian and TobagonianTsimshianTurkishU.S. Virgin IslanderUgandanUkrainianUruguayanUteVenezuelanVietnameseWelshWest IndianYakamaYaquiYugoslavianYumanYup'ikZimbabwean
Immigration
NonimmigrantsImmigrantsAfghanistanAfricaAlbaniaArgentinaArmeniaAsiaAustraliaAustriaBahamasBangladeshBarbadosBelarusBelgiumBelizeBoliviaBosnia and HerzegovinaBrazilBulgariaBurma/MyanmarCabo VerdeCambodiaCameroonCanadaCaribbeanCentral AmericaChileChinaColombiaCongoCosta RicaCroatiaCubaCzechoslovakiaDenmarkDominicaDominican RepublicEastern AfricaEastern AsiaEastern EuropeEcuadorEgyptEl SalvadorEnglandEritreaEthiopiaEuropeFijiFranceGermanyGhanaGreeceGrenadaGuatemalaGuyanaHaitiHondurasHong KongHungaryIndiaIndonesiaIranIraqIrelandIsraelItalyJamaicaJapanJordanKazakhstanKenyaKoreaKuwaitLaosLatin AmericaLatviaLebanonLiberiaLithuaniaMalaysiaMexicoMicronesiaMiddle AfricaMoldovaMoroccoNepalNetherlandsNicaraguaNigeriaNorth AmericaNorth MacedoniaNorthern AfricaNorthern EuropeNorwayOceaniaPakistanPanamaPeruPhilippinesPolandPortugalRomaniaRussiaSaudi ArabiaScotlandSenegalSerbiaSierra LeoneSingaporeSomaliaSouth AfricaSouth AmericaSouth Central AsiaSouth Eastern AsiaSouthern EuropeSpainSri LankaSt. Vincent and the GrenadinesSudanSwedenSwitzerlandSyriaTaiwanThailandTrinidad and TobagoTurkeyUgandaUkraineUruguayUzbekistanVenezuelaVietnamWest IndiesWestern AfricaWestern AsiaWestern EuropeYemenZaireZimbabweAzores
Icelander
Race
Ancestry
AfghanAfricanAlaska NativeAlaskan AthabascanAlbanianAleutAlsatianAmericanApacheArabArapahoArgentineanArmenianAssyrian/Chaldean/SyriacAustralianAustrianBahamianBangladeshiBarbadianBasqueBelgianBelizeanBermudanBhutaneseBlackfeetBolivianBrazilianBritishBritish West IndianBulgarianBurmeseCajunCambodianCanadianCape VerdeanCarpatho RusynCelticCentral AmericanCentral American IndianCherokeeCheyenneChickasawChileanChineseChippewaChoctawColombianColvilleComancheCosta RicanCreeCreekCroatianCrowCubanCypriotCzechCzechoslovakianDanishDelawareDominicanDutchDutch West IndianEastern EuropeanEcuadorianEgyptianEnglishEstonianEthiopianEuropeanFijianFilipinoFinnishFrenchFrench American IndianFrench CanadianGermanGerman RussianGhanaianGreekGuamanian/ChamorroGuatemalanGuyaneseHaitianHmongHonduranHopiHoumaHungarianIcelanderIndian (Asian)IndonesianInupiatIranianIraqiIrishIroquoisIsraeliItalianJamaicanJapaneseJordanianKenyanKiowaKoreanLaotianLatvianLebaneseLiberianLithuanianLumbeeLuxembourgerMacedonianMalaysianMalteseMarshalleseMenomineeMexicanMexican American IndianMongolianMoroccanNative HawaiianNavajoNepaleseNew ZealanderNicaraguanNigerianNorthern EuropeanNorwegianOkinawanOsageOttawaPaiutePakistaniPalestinianPanamanianParaguayanPennsylvania GermanPeruvianPimaPolishPortuguesePotawatomiPuebloPuerto RicanPuget Sound SalishRomanianRussianSalvadoranSamoanScandinavianScotch-IrishScottishSeminoleSenegaleseSerbianShoshoneSierra LeoneanSiouxSlavicSlovakSloveneSomaliSouth AfricanSouth AmericanSouth American IndianSoviet UnionSpaniardSpanishSpanish AmericanSpanish American IndianSri LankanSubsaharan AfricanSudaneseSwedishSwissSyrianTaiwaneseThaiTlingit-HaidaTohono O'OdhamTonganTrinidadian and TobagonianTsimshianTurkishU.S. Virgin IslanderUgandanUkrainianUteVenezuelanVietnameseWelshWest IndianYakamaYaquiYugoslavianYumanYup'ikZimbabwean
Immigration
NonimmigrantsImmigrantsAfghanistanAfricaAlbaniaArgentinaArmeniaAsiaAustraliaAustriaBahamasBangladeshBarbadosBelarusBelgiumBelizeBoliviaBosnia and HerzegovinaBrazilBulgariaBurma/MyanmarCabo VerdeCambodiaCameroonCanadaCaribbeanCentral AmericaChileChinaColombiaCongoCosta RicaCroatiaCubaCzechoslovakiaDenmarkDominicaDominican RepublicEastern AfricaEastern AsiaEastern EuropeEcuadorEgyptEl SalvadorEnglandEritreaEthiopiaEuropeFijiFranceGermanyGhanaGreeceGrenadaGuatemalaGuyanaHaitiHondurasHong KongHungaryIndiaIndonesiaIranIraqIrelandIsraelItalyJamaicaJapanJordanKazakhstanKenyaKoreaKuwaitLaosLatin AmericaLatviaLebanonLiberiaLithuaniaMalaysiaMexicoMicronesiaMiddle AfricaMoldovaMoroccoNepalNetherlandsNicaraguaNigeriaNorth AmericaNorth MacedoniaNorthern AfricaNorthern EuropeNorwayOceaniaPakistanPanamaPeruPhilippinesPolandPortugalRomaniaRussiaSaudi ArabiaScotlandSenegalSerbiaSierra LeoneSingaporeSomaliaSouth AfricaSouth AmericaSouth Central AsiaSouth Eastern AsiaSouthern EuropeSpainSri LankaSt. Vincent and the GrenadinesSudanSwedenSwitzerlandSyriaTaiwanThailandTrinidad and TobagoTurkeyUgandaUkraineUruguayUzbekistanVenezuelaVietnamWest IndiesWestern AfricaWestern AsiaWestern EuropeYemenZaireZimbabweAzores
Child Poverty Under the Age of 16
Income
Poverty
Unemployment
Labor Participation
Family Structure
Vehicle Availability
Education Level
Disability

Child Poverty Under the Age of 16 Comparison

Uruguayans

Icelanders

Average
Excellent
16.1%
CHILD POVERTY UNDER THE AGE OF 16
54.7/ 100
METRIC RATING
169th/ 347
METRIC RANK
15.4%
CHILD POVERTY UNDER THE AGE OF 16
82.5/ 100
METRIC RATING
143rd/ 347
METRIC RANK

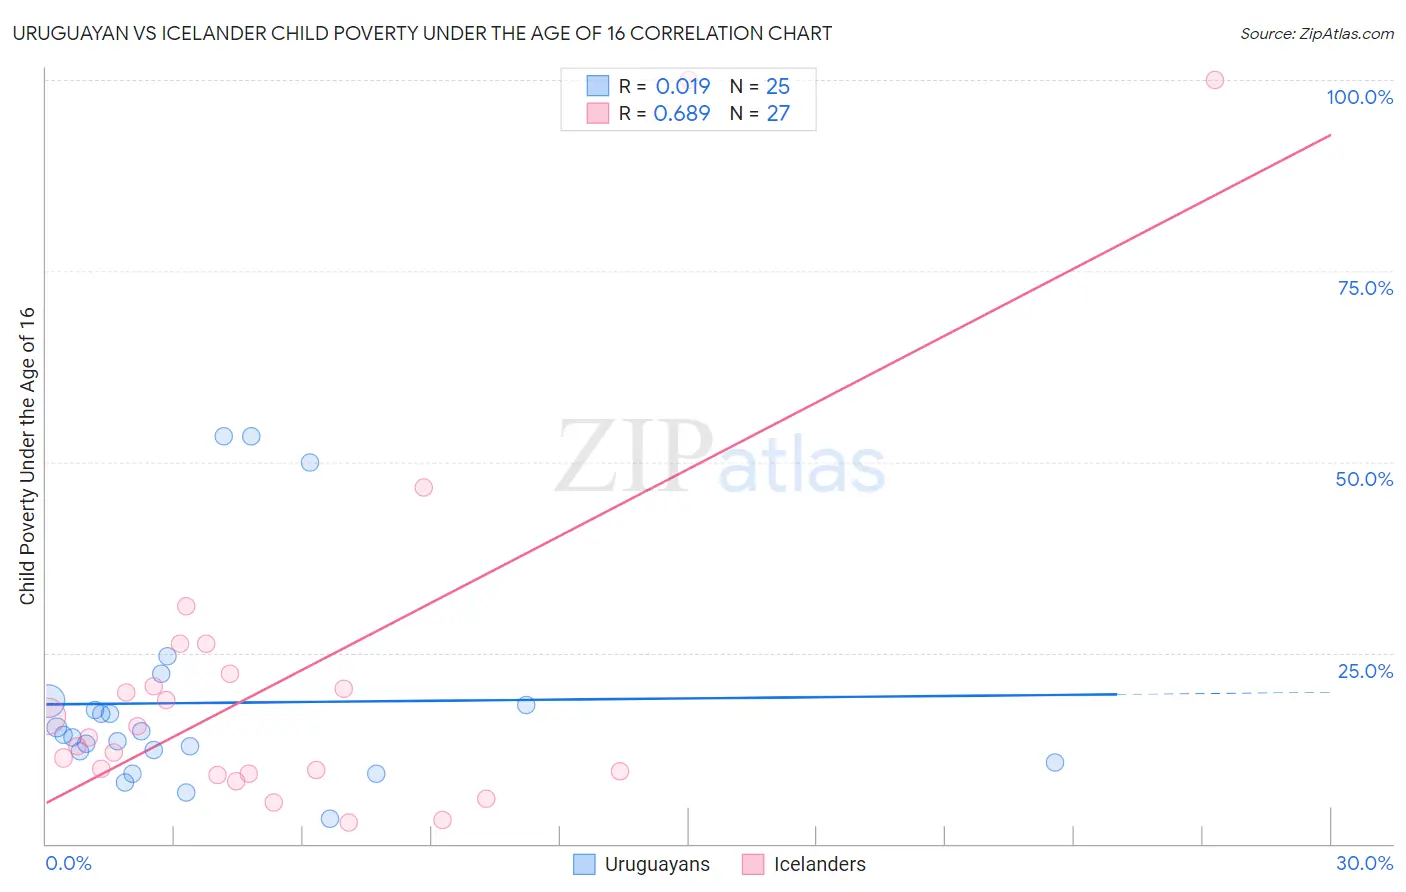
Uruguayan vs Icelander Child Poverty Under the Age of 16 Correlation Chart

The statistical analysis conducted on geographies consisting of 144,396,450 people shows no correlation between the proportion of Uruguayans and poverty level among children under the age of 16 in the United States with a correlation coefficient (R) of 0.019 and weighted average of 16.1%. Similarly, the statistical analysis conducted on geographies consisting of 158,777,342 people shows a significant positive correlation between the proportion of Icelanders and poverty level among children under the age of 16 in the United States with a correlation coefficient (R) of 0.689 and weighted average of 15.4%, a difference of 4.3%.
Uruguayan vs Icelander Child Poverty Under the Age of 16

Child Poverty Under the Age of 16 Correlation Summary

MeasurementUruguayanIcelander
Minimum3.3%2.9%
Maximum53.4%100.0%
Range50.1%97.1%
Mean18.4%21.7%
Median14.2%14.0%
Interquartile 25% (IQ1)11.4%9.1%
Interquartile 75% (IQ3)18.4%22.2%
Interquartile Range (IQR)7.0%13.1%
Standard Deviation (Sample)13.6%24.5%
Standard Deviation (Population)13.3%24.0%

Similar Demographics by Child Poverty Under the Age of 16

Demographics Similar to Uruguayans by Child Poverty Under the Age of 16

In terms of child poverty under the age of 16, the demographic groups most similar to Uruguayans are Immigrants from Colombia (16.1%, a difference of 0.040%), Hungarian (16.2%, a difference of 0.27%), Afghan (16.2%, a difference of 0.29%), Immigrants from Saudi Arabia (16.2%, a difference of 0.31%), and South American (16.0%, a difference of 0.40%).
DemographicsRating | RankChild Poverty Under the Age of 16
Colombians
67.6
/100
|
#162
Good
15.8%
Yugoslavians
67.6
/100
|
#163
Good
15.8%
Immigrants | Germany
67.3
/100
|
#164
Good
15.8%
Guamanians/Chamorros
66.4
/100
|
#165
Good
15.9%
Immigrants | Oceania
65.4
/100
|
#166
Good
15.9%
Costa Ricans
61.1
/100
|
#167
Good
16.0%
South Americans
57.9
/100
|
#168
Average
16.0%
Uruguayans
54.7
/100
|
#169
Average
16.1%
Immigrants | Colombia
54.4
/100
|
#170
Average
16.1%
Hungarians
52.5
/100
|
#171
Average
16.2%
Afghans
52.3
/100
|
#172
Average
16.2%
Immigrants | Saudi Arabia
52.1
/100
|
#173
Average
16.2%
Whites/Caucasians
50.0
/100
|
#174
Average
16.2%
Scotch-Irish
47.1
/100
|
#175
Average
16.3%
Lebanese
45.9
/100
|
#176
Average
16.3%

Demographics Similar to Icelanders by Child Poverty Under the Age of 16

In terms of child poverty under the age of 16, the demographic groups most similar to Icelanders are Brazilian (15.4%, a difference of 0.070%), Immigrants from Hungary (15.5%, a difference of 0.12%), Immigrants from Peru (15.5%, a difference of 0.17%), Slovak (15.5%, a difference of 0.21%), and Slavic (15.4%, a difference of 0.41%).
DemographicsRating | RankChild Poverty Under the Age of 16
Immigrants | Spain
87.3
/100
|
#136
Excellent
15.3%
Peruvians
87.2
/100
|
#137
Excellent
15.3%
Welsh
87.2
/100
|
#138
Excellent
15.3%
Immigrants | Vietnam
87.1
/100
|
#139
Excellent
15.3%
New Zealanders
86.9
/100
|
#140
Excellent
15.3%
Slavs
84.2
/100
|
#141
Excellent
15.4%
Brazilians
82.8
/100
|
#142
Excellent
15.4%
Icelanders
82.5
/100
|
#143
Excellent
15.4%
Immigrants | Hungary
81.9
/100
|
#144
Excellent
15.5%
Immigrants | Peru
81.7
/100
|
#145
Excellent
15.5%
Slovaks
81.4
/100
|
#146
Excellent
15.5%
Immigrants | Kuwait
80.5
/100
|
#147
Excellent
15.5%
Puget Sound Salish
80.3
/100
|
#148
Excellent
15.5%
Israelis
80.1
/100
|
#149
Excellent
15.5%
Immigrants | Jordan
78.5
/100
|
#150
Good
15.6%