Tsimshian vs Immigrants from Senegal Child Poverty Among Boys Under 16
COMPARE
Tsimshian
Immigrants from Senegal
Child Poverty Among Boys Under 16
Child Poverty Among Boys Under 16 Comparison
Tsimshian
Immigrants from Senegal
16.4%
CHILD POVERTY AMONG BOYS UNDER 16
50.5/ 100
METRIC RATING
173rd/ 347
METRIC RANK
20.7%
CHILD POVERTY AMONG BOYS UNDER 16
0.0/ 100
METRIC RATING
293rd/ 347
METRIC RANK
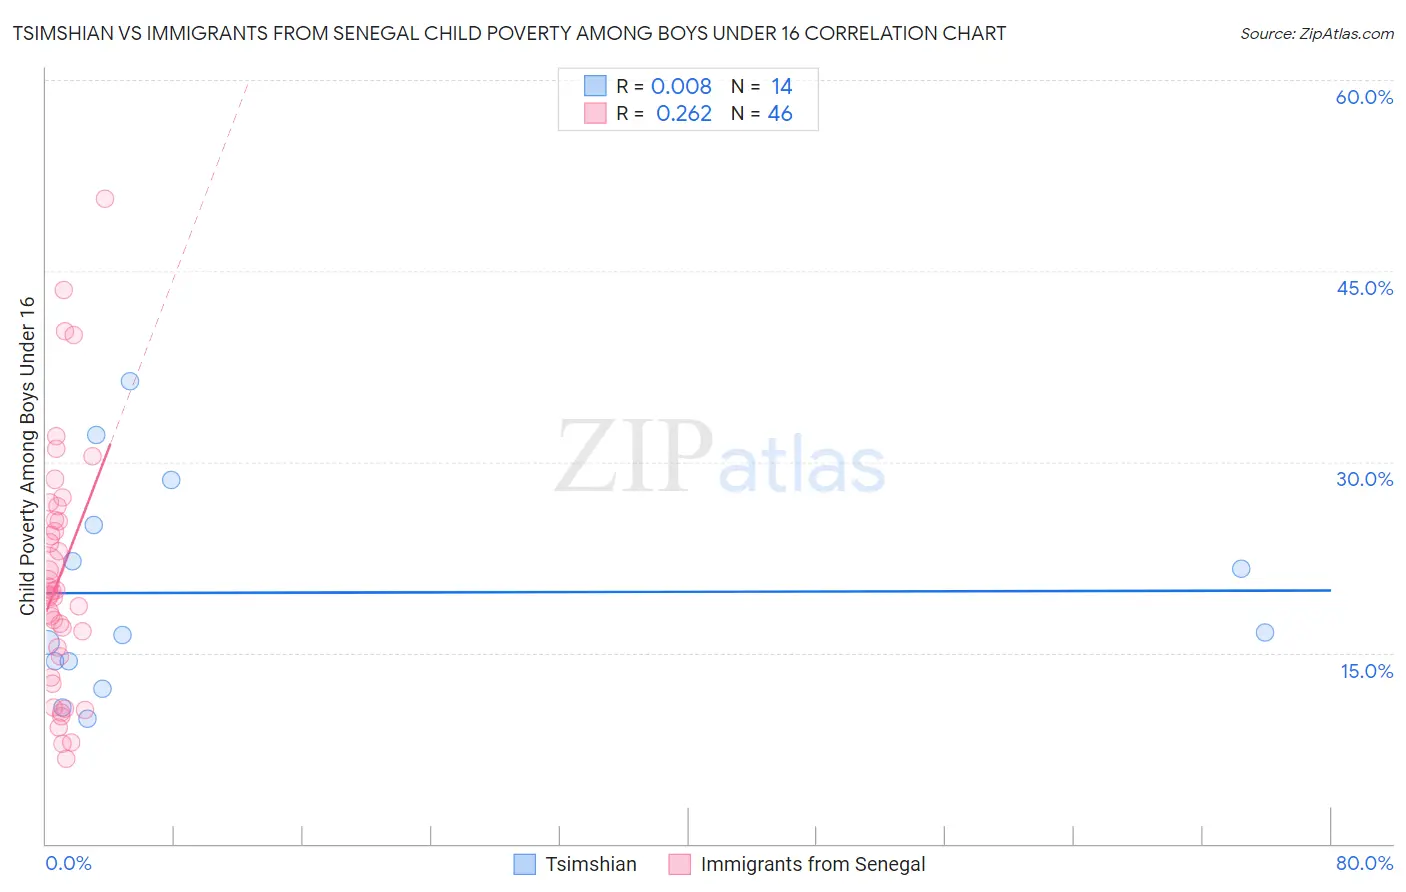
Tsimshian vs Immigrants from Senegal Child Poverty Among Boys Under 16 Correlation Chart
The statistical analysis conducted on geographies consisting of 15,622,353 people shows no correlation between the proportion of Tsimshian and poverty level among boys under the age of 16 in the United States with a correlation coefficient (R) of 0.008 and weighted average of 16.4%. Similarly, the statistical analysis conducted on geographies consisting of 89,864,954 people shows a weak positive correlation between the proportion of Immigrants from Senegal and poverty level among boys under the age of 16 in the United States with a correlation coefficient (R) of 0.262 and weighted average of 20.7%, a difference of 26.0%.
Child Poverty Among Boys Under 16 Correlation Summary
| Measurement | Tsimshian | Immigrants from Senegal |
| Minimum | 9.9% | 6.7% |
| Maximum | 36.4% | 50.7% |
| Range | 26.5% | 44.0% |
| Mean | 19.7% | 21.0% |
| Median | 16.5% | 19.7% |
| Interquartile 25% (IQ1) | 14.3% | 14.7% |
| Interquartile 75% (IQ3) | 25.0% | 25.5% |
| Interquartile Range (IQR) | 10.7% | 10.7% |
| Standard Deviation (Sample) | 8.2% | 9.7% |
| Standard Deviation (Population) | 7.9% | 9.6% |
Similar Demographics by Child Poverty Among Boys Under 16
Demographics Similar to Tsimshian by Child Poverty Among Boys Under 16
In terms of child poverty among boys under 16, the demographic groups most similar to Tsimshian are Immigrants from Colombia (16.4%, a difference of 0.030%), Uruguayan (16.4%, a difference of 0.060%), Immigrants from Ethiopia (16.4%, a difference of 0.080%), Immigrants from Bosnia and Herzegovina (16.4%, a difference of 0.14%), and Immigrants from Syria (16.5%, a difference of 0.16%).
| Demographics | Rating | Rank | Child Poverty Among Boys Under 16 |
| Immigrants | Germany | 63.6 /100 | #166 | Good 16.2% |
| Afghans | 55.4 /100 | #167 | Average 16.3% |
| South Americans | 55.3 /100 | #168 | Average 16.3% |
| Immigrants | Saudi Arabia | 53.6 /100 | #169 | Average 16.4% |
| Immigrants | Bosnia and Herzegovina | 51.7 /100 | #170 | Average 16.4% |
| Immigrants | Ethiopia | 51.3 /100 | #171 | Average 16.4% |
| Immigrants | Colombia | 50.8 /100 | #172 | Average 16.4% |
| Tsimshian | 50.5 /100 | #173 | Average 16.4% |
| Uruguayans | 50.0 /100 | #174 | Average 16.4% |
| Immigrants | Syria | 49.0 /100 | #175 | Average 16.5% |
| Whites/Caucasians | 48.2 /100 | #176 | Average 16.5% |
| Ethiopians | 47.8 /100 | #177 | Average 16.5% |
| Scotch-Irish | 47.5 /100 | #178 | Average 16.5% |
| Hungarians | 47.3 /100 | #179 | Average 16.5% |
| Hawaiians | 45.5 /100 | #180 | Average 16.5% |
Demographics Similar to Immigrants from Senegal by Child Poverty Among Boys Under 16
In terms of child poverty among boys under 16, the demographic groups most similar to Immigrants from Senegal are Yaqui (20.7%, a difference of 0.010%), Immigrants from Bahamas (20.7%, a difference of 0.11%), Mexican (20.7%, a difference of 0.24%), Immigrants from Latin America (20.6%, a difference of 0.27%), and Indonesian (20.8%, a difference of 0.44%).
| Demographics | Rating | Rank | Child Poverty Among Boys Under 16 |
| West Indians | 0.0 /100 | #286 | Tragic 20.3% |
| Immigrants | Belize | 0.0 /100 | #287 | Tragic 20.3% |
| Immigrants | St. Vincent and the Grenadines | 0.0 /100 | #288 | Tragic 20.3% |
| Blackfeet | 0.0 /100 | #289 | Tragic 20.4% |
| Senegalese | 0.0 /100 | #290 | Tragic 20.6% |
| Immigrants | Latin America | 0.0 /100 | #291 | Tragic 20.6% |
| Yaqui | 0.0 /100 | #292 | Tragic 20.7% |
| Immigrants | Senegal | 0.0 /100 | #293 | Tragic 20.7% |
| Immigrants | Bahamas | 0.0 /100 | #294 | Tragic 20.7% |
| Mexicans | 0.0 /100 | #295 | Tragic 20.7% |
| Indonesians | 0.0 /100 | #296 | Tragic 20.8% |
| Hispanics or Latinos | 0.0 /100 | #297 | Tragic 20.9% |
| Chippewa | 0.0 /100 | #298 | Tragic 21.0% |
| Immigrants | Caribbean | 0.0 /100 | #299 | Tragic 21.0% |
| Haitians | 0.0 /100 | #300 | Tragic 21.0% |