Immigrants from Austria vs Immigrants from Senegal Child Poverty Among Boys Under 16
COMPARE
Immigrants from Austria
Immigrants from Senegal
Child Poverty Among Boys Under 16
Child Poverty Among Boys Under 16 Comparison
Immigrants from Austria
Immigrants from Senegal
14.5%
CHILD POVERTY AMONG BOYS UNDER 16
98.4/ 100
METRIC RATING
69th/ 347
METRIC RANK
20.7%
CHILD POVERTY AMONG BOYS UNDER 16
0.0/ 100
METRIC RATING
293rd/ 347
METRIC RANK
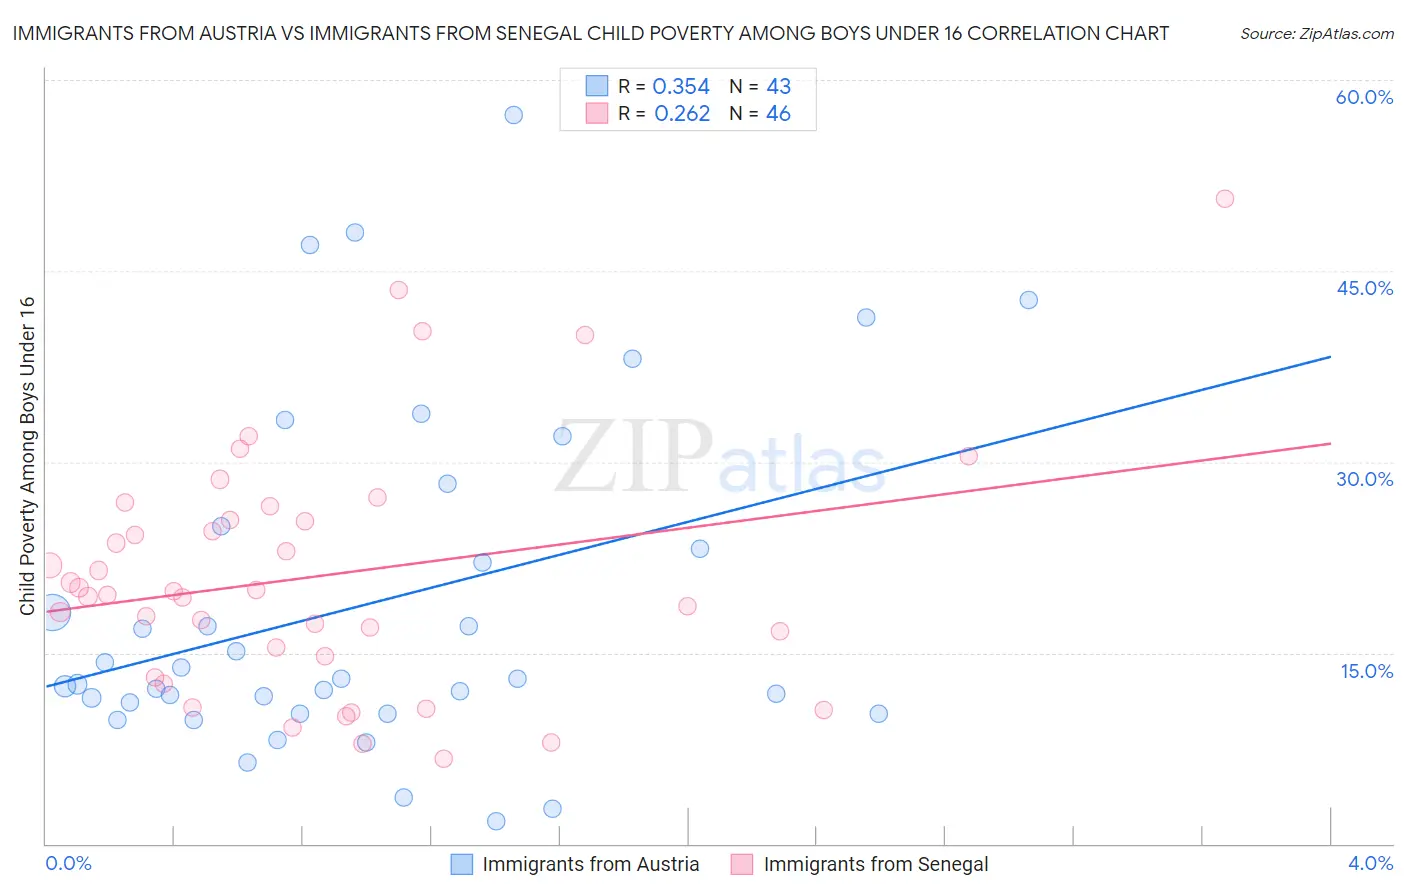
Immigrants from Austria vs Immigrants from Senegal Child Poverty Among Boys Under 16 Correlation Chart
The statistical analysis conducted on geographies consisting of 165,951,164 people shows a mild positive correlation between the proportion of Immigrants from Austria and poverty level among boys under the age of 16 in the United States with a correlation coefficient (R) of 0.354 and weighted average of 14.5%. Similarly, the statistical analysis conducted on geographies consisting of 89,864,954 people shows a weak positive correlation between the proportion of Immigrants from Senegal and poverty level among boys under the age of 16 in the United States with a correlation coefficient (R) of 0.262 and weighted average of 20.7%, a difference of 42.3%.
Child Poverty Among Boys Under 16 Correlation Summary
| Measurement | Immigrants from Austria | Immigrants from Senegal |
| Minimum | 1.7% | 6.7% |
| Maximum | 57.2% | 50.7% |
| Range | 55.5% | 44.0% |
| Mean | 18.8% | 21.0% |
| Median | 12.9% | 19.7% |
| Interquartile 25% (IQ1) | 10.3% | 14.7% |
| Interquartile 75% (IQ3) | 25.0% | 25.5% |
| Interquartile Range (IQR) | 14.7% | 10.7% |
| Standard Deviation (Sample) | 13.4% | 9.7% |
| Standard Deviation (Population) | 13.2% | 9.6% |
Similar Demographics by Child Poverty Among Boys Under 16
Demographics Similar to Immigrants from Austria by Child Poverty Among Boys Under 16
In terms of child poverty among boys under 16, the demographic groups most similar to Immigrants from Austria are European (14.5%, a difference of 0.0%), Slovene (14.5%, a difference of 0.030%), Immigrants from Europe (14.5%, a difference of 0.12%), Immigrants from Bulgaria (14.5%, a difference of 0.15%), and Soviet Union (14.5%, a difference of 0.16%).
| Demographics | Rating | Rank | Child Poverty Among Boys Under 16 |
| Immigrants | Israel | 98.7 /100 | #62 | Exceptional 14.4% |
| Cambodians | 98.5 /100 | #63 | Exceptional 14.5% |
| Immigrants | Romania | 98.5 /100 | #64 | Exceptional 14.5% |
| Soviet Union | 98.5 /100 | #65 | Exceptional 14.5% |
| Immigrants | Bulgaria | 98.5 /100 | #66 | Exceptional 14.5% |
| Immigrants | Europe | 98.4 /100 | #67 | Exceptional 14.5% |
| Slovenes | 98.4 /100 | #68 | Exceptional 14.5% |
| Immigrants | Austria | 98.4 /100 | #69 | Exceptional 14.5% |
| Europeans | 98.4 /100 | #70 | Exceptional 14.5% |
| Immigrants | Netherlands | 98.1 /100 | #71 | Exceptional 14.6% |
| Immigrants | Latvia | 98.1 /100 | #72 | Exceptional 14.6% |
| Immigrants | Turkey | 98.0 /100 | #73 | Exceptional 14.6% |
| Australians | 98.0 /100 | #74 | Exceptional 14.7% |
| Immigrants | Poland | 97.9 /100 | #75 | Exceptional 14.7% |
| Immigrants | Croatia | 97.9 /100 | #76 | Exceptional 14.7% |
Demographics Similar to Immigrants from Senegal by Child Poverty Among Boys Under 16
In terms of child poverty among boys under 16, the demographic groups most similar to Immigrants from Senegal are Yaqui (20.7%, a difference of 0.010%), Immigrants from Bahamas (20.7%, a difference of 0.11%), Mexican (20.7%, a difference of 0.24%), Immigrants from Latin America (20.6%, a difference of 0.27%), and Indonesian (20.8%, a difference of 0.44%).
| Demographics | Rating | Rank | Child Poverty Among Boys Under 16 |
| West Indians | 0.0 /100 | #286 | Tragic 20.3% |
| Immigrants | Belize | 0.0 /100 | #287 | Tragic 20.3% |
| Immigrants | St. Vincent and the Grenadines | 0.0 /100 | #288 | Tragic 20.3% |
| Blackfeet | 0.0 /100 | #289 | Tragic 20.4% |
| Senegalese | 0.0 /100 | #290 | Tragic 20.6% |
| Immigrants | Latin America | 0.0 /100 | #291 | Tragic 20.6% |
| Yaqui | 0.0 /100 | #292 | Tragic 20.7% |
| Immigrants | Senegal | 0.0 /100 | #293 | Tragic 20.7% |
| Immigrants | Bahamas | 0.0 /100 | #294 | Tragic 20.7% |
| Mexicans | 0.0 /100 | #295 | Tragic 20.7% |
| Indonesians | 0.0 /100 | #296 | Tragic 20.8% |
| Hispanics or Latinos | 0.0 /100 | #297 | Tragic 20.9% |
| Chippewa | 0.0 /100 | #298 | Tragic 21.0% |
| Immigrants | Caribbean | 0.0 /100 | #299 | Tragic 21.0% |
| Haitians | 0.0 /100 | #300 | Tragic 21.0% |