Syrian vs Welsh Seniors Poverty Over the Age of 75
COMPARE
Syrian
Welsh
Seniors Poverty Over the Age of 75
Seniors Poverty Over the Age of 75 Comparison
Syrians
Welsh
11.6%
SENIORS POVERTY OVER THE AGE OF 75
91.1/ 100
METRIC RATING
100th/ 347
METRIC RANK
10.5%
SENIORS POVERTY OVER THE AGE OF 75
99.9/ 100
METRIC RATING
18th/ 347
METRIC RANK
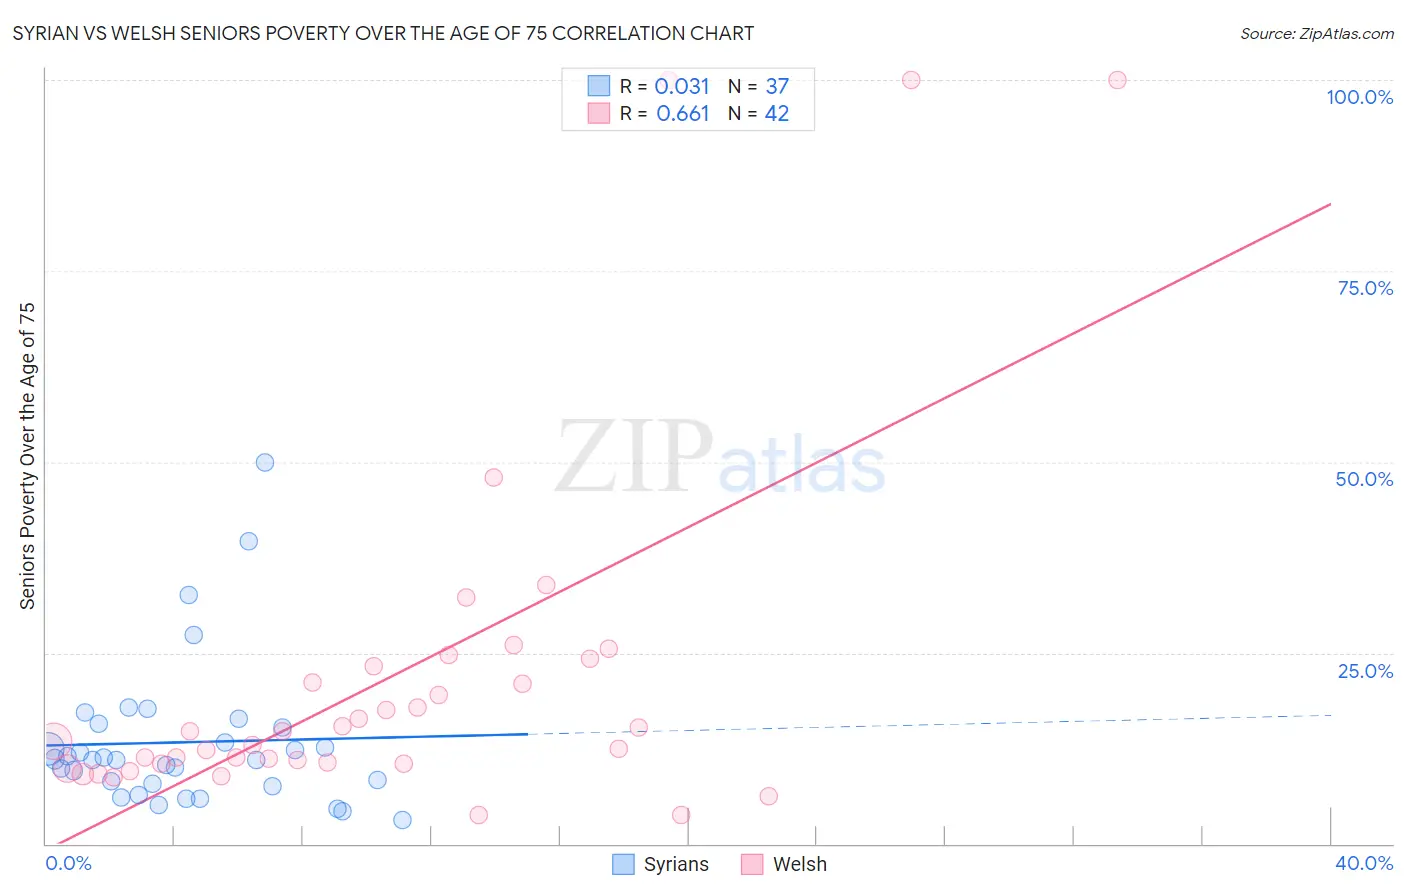
Syrian vs Welsh Seniors Poverty Over the Age of 75 Correlation Chart
The statistical analysis conducted on geographies consisting of 264,328,222 people shows no correlation between the proportion of Syrians and poverty level among seniors over the age of 75 in the United States with a correlation coefficient (R) of 0.031 and weighted average of 11.6%. Similarly, the statistical analysis conducted on geographies consisting of 515,966,529 people shows a significant positive correlation between the proportion of Welsh and poverty level among seniors over the age of 75 in the United States with a correlation coefficient (R) of 0.661 and weighted average of 10.5%, a difference of 10.1%.
Seniors Poverty Over the Age of 75 Correlation Summary
| Measurement | Syrian | Welsh |
| Minimum | 3.1% | 3.7% |
| Maximum | 50.0% | 100.0% |
| Range | 46.9% | 96.3% |
| Mean | 13.3% | 21.9% |
| Median | 11.0% | 14.1% |
| Interquartile 25% (IQ1) | 7.8% | 10.4% |
| Interquartile 75% (IQ3) | 15.5% | 23.3% |
| Interquartile Range (IQR) | 7.7% | 12.8% |
| Standard Deviation (Sample) | 9.7% | 23.5% |
| Standard Deviation (Population) | 9.6% | 23.3% |
Similar Demographics by Seniors Poverty Over the Age of 75
Demographics Similar to Syrians by Seniors Poverty Over the Age of 75
In terms of seniors poverty over the age of 75, the demographic groups most similar to Syrians are Jordanian (11.6%, a difference of 0.080%), Guamanian/Chamorro (11.6%, a difference of 0.12%), Immigrants from Ethiopia (11.6%, a difference of 0.16%), Immigrants from Kuwait (11.6%, a difference of 0.16%), and Immigrants from Singapore (11.6%, a difference of 0.21%).
| Demographics | Rating | Rank | Seniors Poverty Over the Age of 75 |
| Immigrants | Poland | 92.9 /100 | #93 | Exceptional 11.6% |
| Creek | 92.7 /100 | #94 | Exceptional 11.6% |
| Immigrants | Bosnia and Herzegovina | 92.6 /100 | #95 | Exceptional 11.6% |
| Immigrants | Sweden | 92.6 /100 | #96 | Exceptional 11.6% |
| Romanians | 92.3 /100 | #97 | Exceptional 11.6% |
| Immigrants | Japan | 91.9 /100 | #98 | Exceptional 11.6% |
| Immigrants | Ethiopia | 91.7 /100 | #99 | Exceptional 11.6% |
| Syrians | 91.1 /100 | #100 | Exceptional 11.6% |
| Jordanians | 90.8 /100 | #101 | Exceptional 11.6% |
| Guamanians/Chamorros | 90.6 /100 | #102 | Exceptional 11.6% |
| Immigrants | Kuwait | 90.5 /100 | #103 | Exceptional 11.6% |
| Immigrants | Singapore | 90.3 /100 | #104 | Exceptional 11.6% |
| Chickasaw | 90.2 /100 | #105 | Exceptional 11.6% |
| Russians | 89.9 /100 | #106 | Excellent 11.6% |
| Immigrants | Oceania | 89.4 /100 | #107 | Excellent 11.7% |
Demographics Similar to Welsh by Seniors Poverty Over the Age of 75
In terms of seniors poverty over the age of 75, the demographic groups most similar to Welsh are Slovak (10.5%, a difference of 0.010%), Immigrants from Scotland (10.5%, a difference of 0.040%), Czech (10.5%, a difference of 0.050%), Slovene (10.6%, a difference of 0.090%), and Dutch (10.5%, a difference of 0.21%).
| Demographics | Rating | Rank | Seniors Poverty Over the Age of 75 |
| Immigrants | India | 99.9 /100 | #11 | Exceptional 10.4% |
| Tongans | 99.9 /100 | #12 | Exceptional 10.5% |
| Croatians | 99.9 /100 | #13 | Exceptional 10.5% |
| Scottish | 99.9 /100 | #14 | Exceptional 10.5% |
| Europeans | 99.9 /100 | #15 | Exceptional 10.5% |
| Dutch | 99.9 /100 | #16 | Exceptional 10.5% |
| Slovaks | 99.9 /100 | #17 | Exceptional 10.5% |
| Welsh | 99.9 /100 | #18 | Exceptional 10.5% |
| Immigrants | Scotland | 99.9 /100 | #19 | Exceptional 10.5% |
| Czechs | 99.9 /100 | #20 | Exceptional 10.5% |
| Slovenes | 99.9 /100 | #21 | Exceptional 10.6% |
| Bhutanese | 99.8 /100 | #22 | Exceptional 10.6% |
| Lithuanians | 99.8 /100 | #23 | Exceptional 10.6% |
| Poles | 99.8 /100 | #24 | Exceptional 10.6% |
| Menominee | 99.8 /100 | #25 | Exceptional 10.6% |