Spaniard vs Welsh Seniors Poverty Over the Age of 75
COMPARE
Spaniard
Welsh
Seniors Poverty Over the Age of 75
Seniors Poverty Over the Age of 75 Comparison
Spaniards
Welsh
12.2%
SENIORS POVERTY OVER THE AGE OF 75
51.6/ 100
METRIC RATING
171st/ 347
METRIC RANK
10.5%
SENIORS POVERTY OVER THE AGE OF 75
99.9/ 100
METRIC RATING
18th/ 347
METRIC RANK
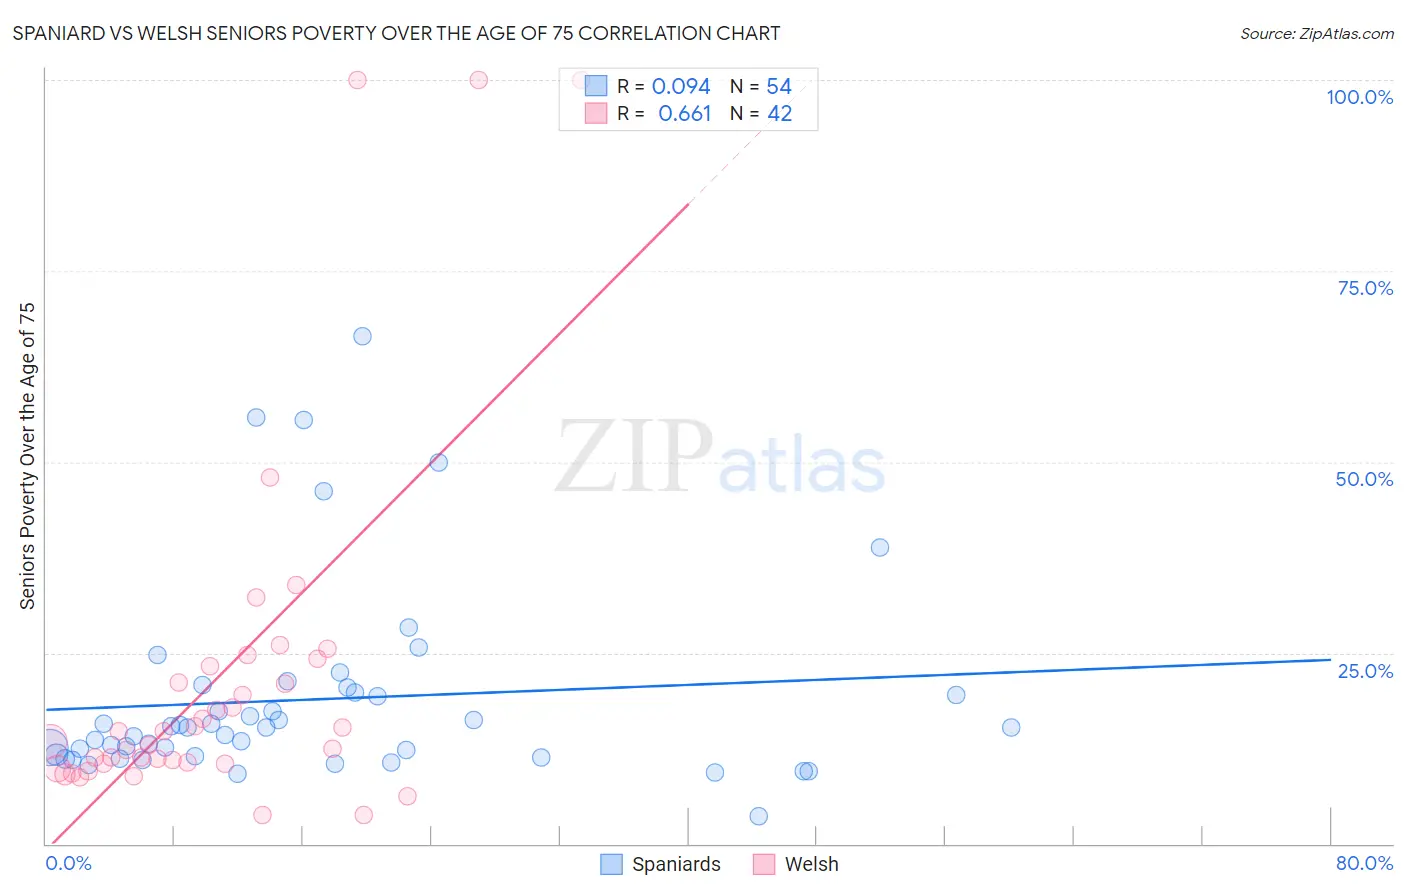
Spaniard vs Welsh Seniors Poverty Over the Age of 75 Correlation Chart
The statistical analysis conducted on geographies consisting of 437,059,242 people shows a slight positive correlation between the proportion of Spaniards and poverty level among seniors over the age of 75 in the United States with a correlation coefficient (R) of 0.094 and weighted average of 12.2%. Similarly, the statistical analysis conducted on geographies consisting of 515,966,529 people shows a significant positive correlation between the proportion of Welsh and poverty level among seniors over the age of 75 in the United States with a correlation coefficient (R) of 0.661 and weighted average of 10.5%, a difference of 15.4%.
Seniors Poverty Over the Age of 75 Correlation Summary
| Measurement | Spaniard | Welsh |
| Minimum | 3.6% | 3.7% |
| Maximum | 66.4% | 100.0% |
| Range | 62.8% | 96.3% |
| Mean | 18.9% | 21.9% |
| Median | 15.2% | 14.1% |
| Interquartile 25% (IQ1) | 11.4% | 10.4% |
| Interquartile 75% (IQ3) | 19.8% | 23.3% |
| Interquartile Range (IQR) | 8.4% | 12.8% |
| Standard Deviation (Sample) | 13.0% | 23.5% |
| Standard Deviation (Population) | 12.9% | 23.3% |
Similar Demographics by Seniors Poverty Over the Age of 75
Demographics Similar to Spaniards by Seniors Poverty Over the Age of 75
In terms of seniors poverty over the age of 75, the demographic groups most similar to Spaniards are Immigrants from Fiji (12.2%, a difference of 0.010%), Immigrants from Thailand (12.2%, a difference of 0.030%), Arab (12.2%, a difference of 0.090%), Immigrants from Europe (12.2%, a difference of 0.13%), and Immigrants from Saudi Arabia (12.2%, a difference of 0.17%).
| Demographics | Rating | Rank | Seniors Poverty Over the Age of 75 |
| Potawatomi | 57.4 /100 | #164 | Average 12.1% |
| Okinawans | 56.3 /100 | #165 | Average 12.1% |
| Egyptians | 54.8 /100 | #166 | Average 12.1% |
| Immigrants | Switzerland | 54.5 /100 | #167 | Average 12.1% |
| Immigrants | Syria | 53.9 /100 | #168 | Average 12.2% |
| Immigrants | Egypt | 53.7 /100 | #169 | Average 12.2% |
| Immigrants | Thailand | 52.0 /100 | #170 | Average 12.2% |
| Spaniards | 51.6 /100 | #171 | Average 12.2% |
| Immigrants | Fiji | 51.5 /100 | #172 | Average 12.2% |
| Arabs | 50.5 /100 | #173 | Average 12.2% |
| Immigrants | Europe | 50.0 /100 | #174 | Average 12.2% |
| Immigrants | Saudi Arabia | 49.5 /100 | #175 | Average 12.2% |
| Immigrants | Iran | 48.1 /100 | #176 | Average 12.2% |
| Immigrants | Asia | 47.8 /100 | #177 | Average 12.2% |
| Immigrants | Nonimmigrants | 46.8 /100 | #178 | Average 12.2% |
Demographics Similar to Welsh by Seniors Poverty Over the Age of 75
In terms of seniors poverty over the age of 75, the demographic groups most similar to Welsh are Slovak (10.5%, a difference of 0.010%), Immigrants from Scotland (10.5%, a difference of 0.040%), Czech (10.5%, a difference of 0.050%), Slovene (10.6%, a difference of 0.090%), and Dutch (10.5%, a difference of 0.21%).
| Demographics | Rating | Rank | Seniors Poverty Over the Age of 75 |
| Immigrants | India | 99.9 /100 | #11 | Exceptional 10.4% |
| Tongans | 99.9 /100 | #12 | Exceptional 10.5% |
| Croatians | 99.9 /100 | #13 | Exceptional 10.5% |
| Scottish | 99.9 /100 | #14 | Exceptional 10.5% |
| Europeans | 99.9 /100 | #15 | Exceptional 10.5% |
| Dutch | 99.9 /100 | #16 | Exceptional 10.5% |
| Slovaks | 99.9 /100 | #17 | Exceptional 10.5% |
| Welsh | 99.9 /100 | #18 | Exceptional 10.5% |
| Immigrants | Scotland | 99.9 /100 | #19 | Exceptional 10.5% |
| Czechs | 99.9 /100 | #20 | Exceptional 10.5% |
| Slovenes | 99.9 /100 | #21 | Exceptional 10.6% |
| Bhutanese | 99.8 /100 | #22 | Exceptional 10.6% |
| Lithuanians | 99.8 /100 | #23 | Exceptional 10.6% |
| Poles | 99.8 /100 | #24 | Exceptional 10.6% |
| Menominee | 99.8 /100 | #25 | Exceptional 10.6% |