Immigrants from Australia vs Immigrants from the Azores Seniors Poverty Over the Age of 75
COMPARE
Immigrants from Australia
Immigrants from the Azores
Seniors Poverty Over the Age of 75
Seniors Poverty Over the Age of 75 Comparison
Immigrants from Australia
Immigrants from the Azores
12.2%
SENIORS POVERTY OVER THE AGE OF 75
44.2/ 100
METRIC RATING
181st/ 347
METRIC RANK
15.2%
SENIORS POVERTY OVER THE AGE OF 75
0.0/ 100
METRIC RATING
290th/ 347
METRIC RANK
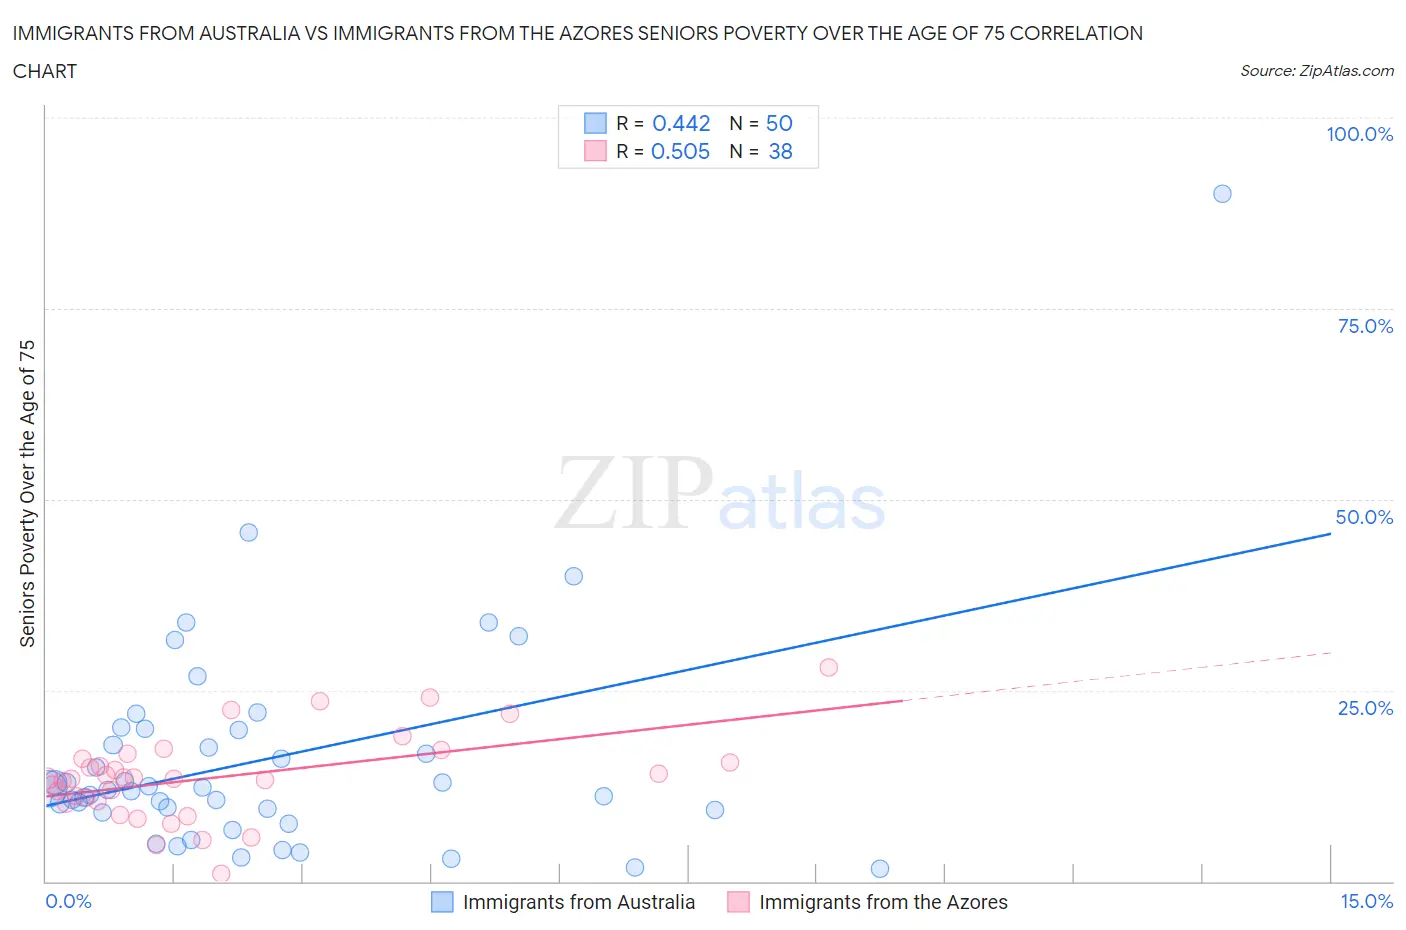
Immigrants from Australia vs Immigrants from the Azores Seniors Poverty Over the Age of 75 Correlation Chart
The statistical analysis conducted on geographies consisting of 225,278,239 people shows a moderate positive correlation between the proportion of Immigrants from Australia and poverty level among seniors over the age of 75 in the United States with a correlation coefficient (R) of 0.442 and weighted average of 12.2%. Similarly, the statistical analysis conducted on geographies consisting of 46,090,908 people shows a substantial positive correlation between the proportion of Immigrants from the Azores and poverty level among seniors over the age of 75 in the United States with a correlation coefficient (R) of 0.505 and weighted average of 15.2%, a difference of 24.0%.
Seniors Poverty Over the Age of 75 Correlation Summary
| Measurement | Immigrants from Australia | Immigrants from the Azores |
| Minimum | 1.7% | 0.91% |
| Maximum | 90.0% | 28.0% |
| Range | 88.3% | 27.1% |
| Mean | 16.1% | 13.6% |
| Median | 12.0% | 13.4% |
| Interquartile 25% (IQ1) | 9.3% | 10.5% |
| Interquartile 75% (IQ3) | 19.8% | 16.0% |
| Interquartile Range (IQR) | 10.5% | 5.5% |
| Standard Deviation (Sample) | 14.6% | 5.6% |
| Standard Deviation (Population) | 14.4% | 5.6% |
Similar Demographics by Seniors Poverty Over the Age of 75
Demographics Similar to Immigrants from Australia by Seniors Poverty Over the Age of 75
In terms of seniors poverty over the age of 75, the demographic groups most similar to Immigrants from Australia are Immigrants from South Eastern Asia (12.2%, a difference of 0.010%), Mongolian (12.2%, a difference of 0.11%), Nonimmigrants (12.2%, a difference of 0.22%), German Russian (12.3%, a difference of 0.23%), and Immigrants from Asia (12.2%, a difference of 0.30%).
| Demographics | Rating | Rank | Seniors Poverty Over the Age of 75 |
| Immigrants | Europe | 50.0 /100 | #174 | Average 12.2% |
| Immigrants | Saudi Arabia | 49.5 /100 | #175 | Average 12.2% |
| Immigrants | Iran | 48.1 /100 | #176 | Average 12.2% |
| Immigrants | Asia | 47.8 /100 | #177 | Average 12.2% |
| Immigrants | Nonimmigrants | 46.8 /100 | #178 | Average 12.2% |
| Mongolians | 45.5 /100 | #179 | Average 12.2% |
| Immigrants | South Eastern Asia | 44.3 /100 | #180 | Average 12.2% |
| Immigrants | Australia | 44.2 /100 | #181 | Average 12.2% |
| German Russians | 41.4 /100 | #182 | Average 12.3% |
| Laotians | 38.2 /100 | #183 | Fair 12.3% |
| Kiowa | 36.0 /100 | #184 | Fair 12.3% |
| Immigrants | Malaysia | 35.8 /100 | #185 | Fair 12.3% |
| Sri Lankans | 32.3 /100 | #186 | Fair 12.4% |
| Yaqui | 25.9 /100 | #187 | Fair 12.5% |
| Immigrants | Northern Africa | 25.2 /100 | #188 | Fair 12.5% |
Demographics Similar to Immigrants from the Azores by Seniors Poverty Over the Age of 75
In terms of seniors poverty over the age of 75, the demographic groups most similar to Immigrants from the Azores are Immigrants from Belize (15.2%, a difference of 0.020%), Paiute (15.2%, a difference of 0.020%), Colville (15.2%, a difference of 0.20%), Jamaican (15.1%, a difference of 0.28%), and Apache (15.3%, a difference of 0.60%).
| Demographics | Rating | Rank | Seniors Poverty Over the Age of 75 |
| Guatemalans | 0.0 /100 | #283 | Tragic 14.8% |
| Cheyenne | 0.0 /100 | #284 | Tragic 14.9% |
| Immigrants | Mexico | 0.0 /100 | #285 | Tragic 14.9% |
| Immigrants | Central America | 0.0 /100 | #286 | Tragic 15.0% |
| Immigrants | Guatemala | 0.0 /100 | #287 | Tragic 15.1% |
| Jamaicans | 0.0 /100 | #288 | Tragic 15.1% |
| Immigrants | Belize | 0.0 /100 | #289 | Tragic 15.2% |
| Immigrants | Azores | 0.0 /100 | #290 | Tragic 15.2% |
| Paiute | 0.0 /100 | #291 | Tragic 15.2% |
| Colville | 0.0 /100 | #292 | Tragic 15.2% |
| Apache | 0.0 /100 | #293 | Tragic 15.3% |
| Immigrants | Jamaica | 0.0 /100 | #294 | Tragic 15.3% |
| U.S. Virgin Islanders | 0.0 /100 | #295 | Tragic 15.4% |
| Yuman | 0.0 /100 | #296 | Tragic 15.4% |
| Hondurans | 0.0 /100 | #297 | Tragic 15.4% |