Sri Lankan vs Immigrants from El Salvador Seniors Poverty Over the Age of 75
COMPARE
Sri Lankan
Immigrants from El Salvador
Seniors Poverty Over the Age of 75
Seniors Poverty Over the Age of 75 Comparison
Sri Lankans
Immigrants from El Salvador
12.4%
SENIORS POVERTY OVER THE AGE OF 75
32.3/ 100
METRIC RATING
186th/ 347
METRIC RANK
14.5%
SENIORS POVERTY OVER THE AGE OF 75
0.0/ 100
METRIC RATING
275th/ 347
METRIC RANK
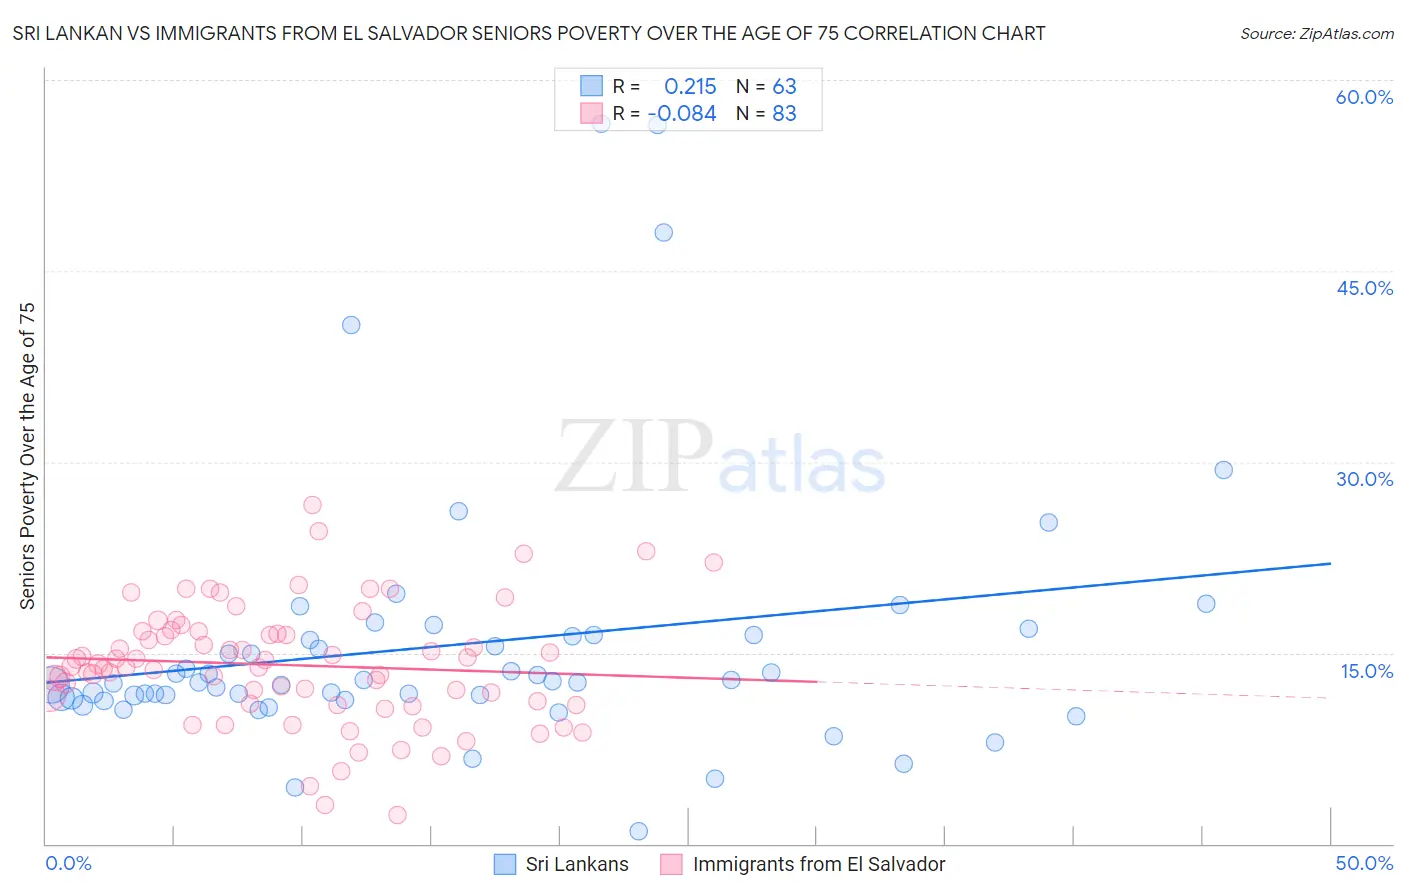
Sri Lankan vs Immigrants from El Salvador Seniors Poverty Over the Age of 75 Correlation Chart
The statistical analysis conducted on geographies consisting of 434,587,181 people shows a weak positive correlation between the proportion of Sri Lankans and poverty level among seniors over the age of 75 in the United States with a correlation coefficient (R) of 0.215 and weighted average of 12.4%. Similarly, the statistical analysis conducted on geographies consisting of 354,525,142 people shows a slight negative correlation between the proportion of Immigrants from El Salvador and poverty level among seniors over the age of 75 in the United States with a correlation coefficient (R) of -0.084 and weighted average of 14.5%, a difference of 16.9%.
Seniors Poverty Over the Age of 75 Correlation Summary
| Measurement | Sri Lankan | Immigrants from El Salvador |
| Minimum | 1.0% | 2.3% |
| Maximum | 56.5% | 26.7% |
| Range | 55.5% | 24.3% |
| Mean | 15.6% | 14.0% |
| Median | 12.7% | 13.9% |
| Interquartile 25% (IQ1) | 11.4% | 11.0% |
| Interquartile 75% (IQ3) | 16.4% | 16.7% |
| Interquartile Range (IQR) | 5.0% | 5.7% |
| Standard Deviation (Sample) | 10.4% | 4.7% |
| Standard Deviation (Population) | 10.3% | 4.6% |
Similar Demographics by Seniors Poverty Over the Age of 75
Demographics Similar to Sri Lankans by Seniors Poverty Over the Age of 75
In terms of seniors poverty over the age of 75, the demographic groups most similar to Sri Lankans are Immigrants from Malaysia (12.3%, a difference of 0.31%), Kiowa (12.3%, a difference of 0.32%), Laotian (12.3%, a difference of 0.52%), Yaqui (12.5%, a difference of 0.63%), and Immigrants from Northern Africa (12.5%, a difference of 0.70%).
| Demographics | Rating | Rank | Seniors Poverty Over the Age of 75 |
| Mongolians | 45.5 /100 | #179 | Average 12.2% |
| Immigrants | South Eastern Asia | 44.3 /100 | #180 | Average 12.2% |
| Immigrants | Australia | 44.2 /100 | #181 | Average 12.2% |
| German Russians | 41.4 /100 | #182 | Average 12.3% |
| Laotians | 38.2 /100 | #183 | Fair 12.3% |
| Kiowa | 36.0 /100 | #184 | Fair 12.3% |
| Immigrants | Malaysia | 35.8 /100 | #185 | Fair 12.3% |
| Sri Lankans | 32.3 /100 | #186 | Fair 12.4% |
| Yaqui | 25.9 /100 | #187 | Fair 12.5% |
| Immigrants | Northern Africa | 25.2 /100 | #188 | Fair 12.5% |
| Immigrants | Indonesia | 24.4 /100 | #189 | Fair 12.5% |
| Immigrants | Congo | 23.9 /100 | #190 | Fair 12.5% |
| Liberians | 23.2 /100 | #191 | Fair 12.5% |
| Choctaw | 20.2 /100 | #192 | Fair 12.5% |
| Taiwanese | 17.8 /100 | #193 | Poor 12.6% |
Demographics Similar to Immigrants from El Salvador by Seniors Poverty Over the Age of 75
In terms of seniors poverty over the age of 75, the demographic groups most similar to Immigrants from El Salvador are Soviet Union (14.5%, a difference of 0.050%), Immigrants from Bahamas (14.4%, a difference of 0.16%), Senegalese (14.5%, a difference of 0.32%), Immigrants from South America (14.4%, a difference of 0.33%), and Mexican (14.4%, a difference of 0.55%).
| Demographics | Rating | Rank | Seniors Poverty Over the Age of 75 |
| Colombians | 0.0 /100 | #268 | Tragic 14.3% |
| Immigrants | Venezuela | 0.0 /100 | #269 | Tragic 14.3% |
| Immigrants | Uruguay | 0.0 /100 | #270 | Tragic 14.3% |
| Immigrants | Ghana | 0.0 /100 | #271 | Tragic 14.4% |
| Mexicans | 0.0 /100 | #272 | Tragic 14.4% |
| Immigrants | South America | 0.0 /100 | #273 | Tragic 14.4% |
| Immigrants | Bahamas | 0.0 /100 | #274 | Tragic 14.4% |
| Immigrants | El Salvador | 0.0 /100 | #275 | Tragic 14.5% |
| Soviet Union | 0.0 /100 | #276 | Tragic 14.5% |
| Senegalese | 0.0 /100 | #277 | Tragic 14.5% |
| Immigrants | Colombia | 0.0 /100 | #278 | Tragic 14.6% |
| Blacks/African Americans | 0.0 /100 | #279 | Tragic 14.6% |
| Central Americans | 0.0 /100 | #280 | Tragic 14.7% |
| Belizeans | 0.0 /100 | #281 | Tragic 14.8% |
| Immigrants | Senegal | 0.0 /100 | #282 | Tragic 14.8% |