Arab vs Immigrants from Bangladesh Child Poverty Among Boys Under 16
COMPARE
Arab
Immigrants from Bangladesh
Child Poverty Among Boys Under 16
Child Poverty Among Boys Under 16 Comparison
Arabs
Immigrants from Bangladesh
16.8%
CHILD POVERTY AMONG BOYS UNDER 16
31.1/ 100
METRIC RATING
190th/ 347
METRIC RANK
19.9%
CHILD POVERTY AMONG BOYS UNDER 16
0.0/ 100
METRIC RATING
274th/ 347
METRIC RANK
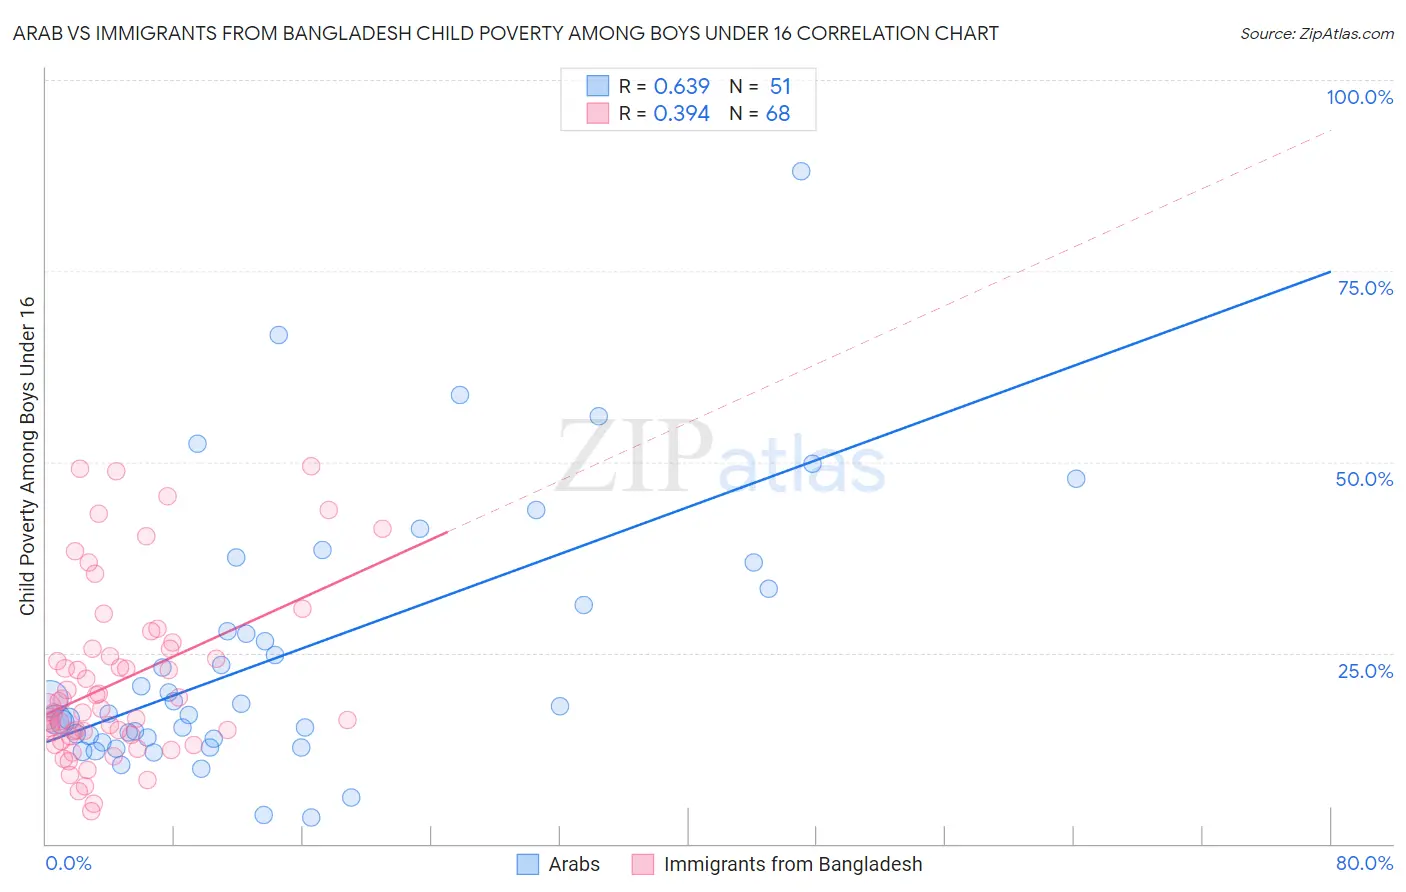
Arab vs Immigrants from Bangladesh Child Poverty Among Boys Under 16 Correlation Chart
The statistical analysis conducted on geographies consisting of 475,195,630 people shows a significant positive correlation between the proportion of Arabs and poverty level among boys under the age of 16 in the United States with a correlation coefficient (R) of 0.639 and weighted average of 16.8%. Similarly, the statistical analysis conducted on geographies consisting of 202,330,281 people shows a mild positive correlation between the proportion of Immigrants from Bangladesh and poverty level among boys under the age of 16 in the United States with a correlation coefficient (R) of 0.394 and weighted average of 19.9%, a difference of 18.6%.
Child Poverty Among Boys Under 16 Correlation Summary
| Measurement | Arab | Immigrants from Bangladesh |
| Minimum | 3.4% | 4.2% |
| Maximum | 88.0% | 49.5% |
| Range | 84.6% | 45.3% |
| Mean | 24.9% | 21.3% |
| Median | 17.9% | 17.8% |
| Interquartile 25% (IQ1) | 13.7% | 14.1% |
| Interquartile 75% (IQ3) | 33.3% | 25.6% |
| Interquartile Range (IQR) | 19.6% | 11.4% |
| Standard Deviation (Sample) | 17.4% | 11.3% |
| Standard Deviation (Population) | 17.2% | 11.2% |
Similar Demographics by Child Poverty Among Boys Under 16
Demographics Similar to Arabs by Child Poverty Among Boys Under 16
In terms of child poverty among boys under 16, the demographic groups most similar to Arabs are Alaska Native (16.8%, a difference of 0.17%), Immigrants from Morocco (16.7%, a difference of 0.42%), Immigrants from South America (16.7%, a difference of 0.81%), Immigrants from Costa Rica (16.7%, a difference of 0.82%), and Hmong (16.6%, a difference of 0.90%).
| Demographics | Rating | Rank | Child Poverty Among Boys Under 16 |
| Kenyans | 41.0 /100 | #183 | Average 16.6% |
| Celtics | 40.6 /100 | #184 | Average 16.6% |
| Immigrants | Western Asia | 40.4 /100 | #185 | Average 16.6% |
| Hmong | 38.4 /100 | #186 | Fair 16.6% |
| Immigrants | Costa Rica | 37.8 /100 | #187 | Fair 16.7% |
| Immigrants | South America | 37.7 /100 | #188 | Fair 16.7% |
| Immigrants | Morocco | 34.5 /100 | #189 | Fair 16.7% |
| Arabs | 31.1 /100 | #190 | Fair 16.8% |
| Alaska Natives | 29.8 /100 | #191 | Fair 16.8% |
| Immigrants | Uganda | 21.6 /100 | #192 | Fair 17.0% |
| Immigrants | Iraq | 21.6 /100 | #193 | Fair 17.0% |
| Immigrants | Lebanon | 21.2 /100 | #194 | Fair 17.0% |
| Spanish | 20.8 /100 | #195 | Fair 17.0% |
| Spaniards | 20.5 /100 | #196 | Fair 17.1% |
| Immigrants | Kenya | 20.1 /100 | #197 | Fair 17.1% |
Demographics Similar to Immigrants from Bangladesh by Child Poverty Among Boys Under 16
In terms of child poverty among boys under 16, the demographic groups most similar to Immigrants from Bangladesh are Jamaican (20.0%, a difference of 0.12%), Belizean (19.9%, a difference of 0.25%), Subsaharan African (20.0%, a difference of 0.29%), Immigrants from Ecuador (19.8%, a difference of 0.39%), and Immigrants from Barbados (20.0%, a difference of 0.39%).
| Demographics | Rating | Rank | Child Poverty Among Boys Under 16 |
| Vietnamese | 0.1 /100 | #267 | Tragic 19.6% |
| Spanish American Indians | 0.1 /100 | #268 | Tragic 19.6% |
| Immigrants | Cabo Verde | 0.1 /100 | #269 | Tragic 19.7% |
| Cherokee | 0.1 /100 | #270 | Tragic 19.7% |
| Chickasaw | 0.1 /100 | #271 | Tragic 19.8% |
| Immigrants | Ecuador | 0.1 /100 | #272 | Tragic 19.8% |
| Belizeans | 0.1 /100 | #273 | Tragic 19.9% |
| Immigrants | Bangladesh | 0.0 /100 | #274 | Tragic 19.9% |
| Jamaicans | 0.0 /100 | #275 | Tragic 20.0% |
| Sub-Saharan Africans | 0.0 /100 | #276 | Tragic 20.0% |
| Immigrants | Barbados | 0.0 /100 | #277 | Tragic 20.0% |
| Immigrants | West Indies | 0.0 /100 | #278 | Tragic 20.0% |
| Bangladeshis | 0.0 /100 | #279 | Tragic 20.0% |
| Central Americans | 0.0 /100 | #280 | Tragic 20.1% |
| Immigrants | Zaire | 0.0 /100 | #281 | Tragic 20.1% |