Soviet Union vs Indian (Asian) Receiving Food Stamps
COMPARE
Soviet Union
Indian (Asian)
Receiving Food Stamps
Receiving Food Stamps Comparison
Soviet Union
Indians (Asian)
11.1%
RECEIVING FOOD STAMPS
83.1/ 100
METRIC RATING
150th/ 347
METRIC RANK
9.6%
RECEIVING FOOD STAMPS
99.4/ 100
METRIC RATING
47th/ 347
METRIC RANK
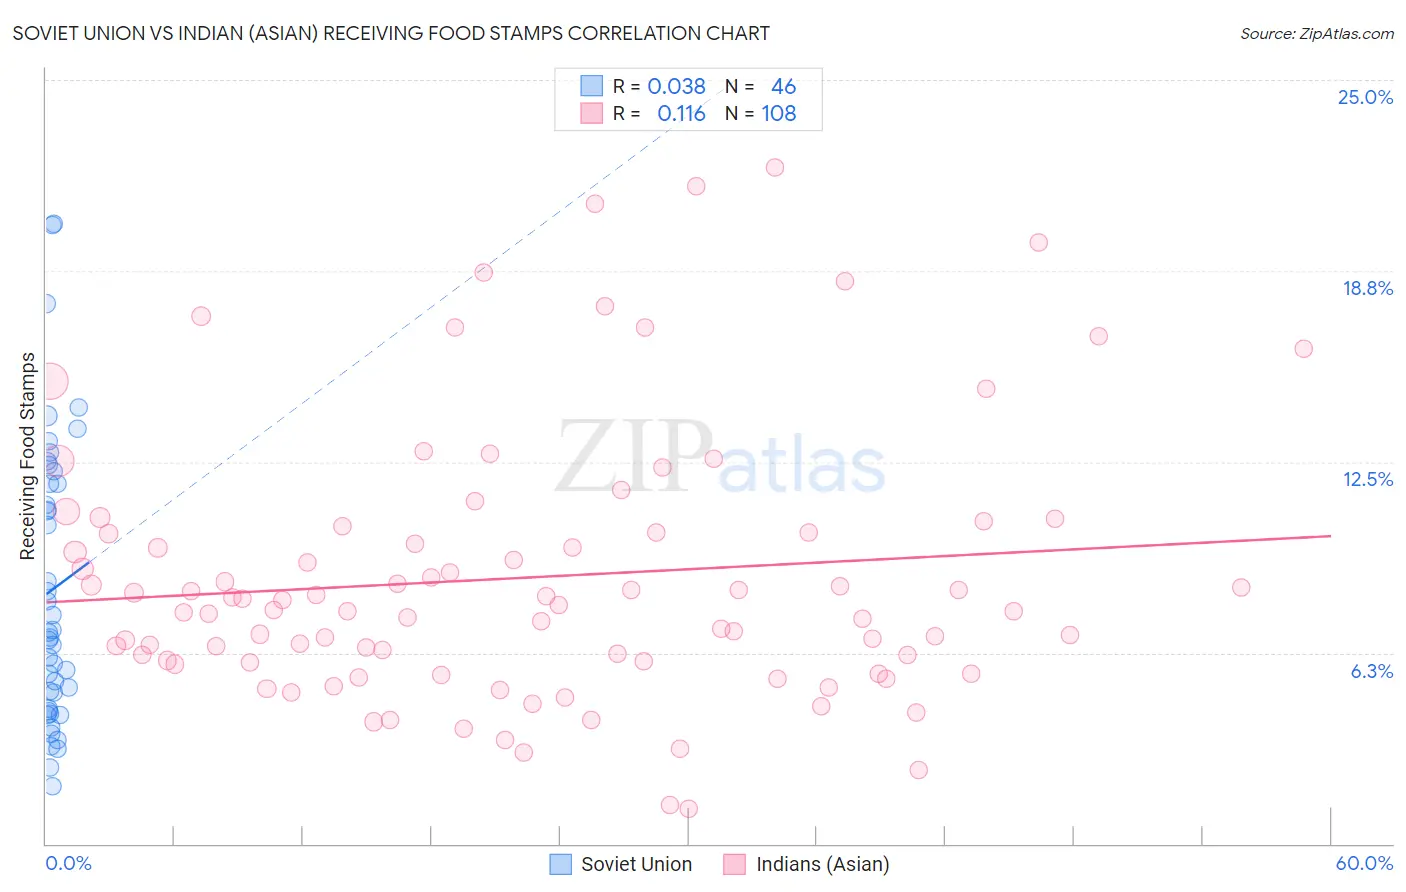
Soviet Union vs Indian (Asian) Receiving Food Stamps Correlation Chart
The statistical analysis conducted on geographies consisting of 43,471,584 people shows no correlation between the proportion of Soviet Union and percentage of population receiving government assistance and/or food stamps in the United States with a correlation coefficient (R) of 0.038 and weighted average of 11.1%. Similarly, the statistical analysis conducted on geographies consisting of 492,865,667 people shows a poor positive correlation between the proportion of Indians (Asian) and percentage of population receiving government assistance and/or food stamps in the United States with a correlation coefficient (R) of 0.116 and weighted average of 9.6%, a difference of 15.1%.
Receiving Food Stamps Correlation Summary
| Measurement | Soviet Union | Indian (Asian) |
| Minimum | 1.9% | 1.2% |
| Maximum | 20.3% | 22.2% |
| Range | 18.4% | 21.0% |
| Mean | 8.3% | 8.7% |
| Median | 6.8% | 7.7% |
| Interquartile 25% (IQ1) | 4.4% | 5.9% |
| Interquartile 75% (IQ3) | 11.8% | 10.2% |
| Interquartile Range (IQR) | 7.4% | 4.2% |
| Standard Deviation (Sample) | 4.6% | 4.4% |
| Standard Deviation (Population) | 4.6% | 4.4% |
Similar Demographics by Receiving Food Stamps
Demographics Similar to Soviet Union by Receiving Food Stamps
In terms of receiving food stamps, the demographic groups most similar to Soviet Union are Brazilian (11.1%, a difference of 0.020%), Immigrants from South Eastern Asia (11.1%, a difference of 0.040%), White/Caucasian (11.1%, a difference of 0.21%), Taiwanese (11.0%, a difference of 0.30%), and Immigrants from Spain (11.1%, a difference of 0.36%).
| Demographics | Rating | Rank | Receiving Food Stamps |
| Immigrants | Northern Africa | 86.0 /100 | #143 | Excellent 11.0% |
| Syrians | 85.5 /100 | #144 | Excellent 11.0% |
| Hungarians | 85.1 /100 | #145 | Excellent 11.0% |
| Taiwanese | 84.2 /100 | #146 | Excellent 11.0% |
| Whites/Caucasians | 83.9 /100 | #147 | Excellent 11.1% |
| Immigrants | South Eastern Asia | 83.3 /100 | #148 | Excellent 11.1% |
| Brazilians | 83.2 /100 | #149 | Excellent 11.1% |
| Soviet Union | 83.1 /100 | #150 | Excellent 11.1% |
| Immigrants | Spain | 81.7 /100 | #151 | Excellent 11.1% |
| Immigrants | Kazakhstan | 81.7 /100 | #152 | Excellent 11.1% |
| Lebanese | 81.6 /100 | #153 | Excellent 11.1% |
| Armenians | 81.4 /100 | #154 | Excellent 11.1% |
| Immigrants | Argentina | 80.4 /100 | #155 | Excellent 11.2% |
| Immigrants | Afghanistan | 75.6 /100 | #156 | Good 11.3% |
| Immigrants | Lebanon | 75.2 /100 | #157 | Good 11.3% |
Demographics Similar to Indians (Asian) by Receiving Food Stamps
In terms of receiving food stamps, the demographic groups most similar to Indians (Asian) are Australian (9.6%, a difference of 0.070%), Russian (9.6%, a difference of 0.11%), Immigrants from Czechoslovakia (9.6%, a difference of 0.13%), Immigrants from Belgium (9.6%, a difference of 0.15%), and Immigrants from Denmark (9.6%, a difference of 0.17%).
| Demographics | Rating | Rank | Receiving Food Stamps |
| Immigrants | Netherlands | 99.5 /100 | #40 | Exceptional 9.5% |
| Cambodians | 99.5 /100 | #41 | Exceptional 9.5% |
| Immigrants | China | 99.5 /100 | #42 | Exceptional 9.6% |
| Croatians | 99.5 /100 | #43 | Exceptional 9.6% |
| Immigrants | Denmark | 99.4 /100 | #44 | Exceptional 9.6% |
| Immigrants | Belgium | 99.4 /100 | #45 | Exceptional 9.6% |
| Australians | 99.4 /100 | #46 | Exceptional 9.6% |
| Indians (Asian) | 99.4 /100 | #47 | Exceptional 9.6% |
| Russians | 99.4 /100 | #48 | Exceptional 9.6% |
| Immigrants | Czechoslovakia | 99.4 /100 | #49 | Exceptional 9.6% |
| Lithuanians | 99.4 /100 | #50 | Exceptional 9.7% |
| Asians | 99.3 /100 | #51 | Exceptional 9.7% |
| Immigrants | South Africa | 99.3 /100 | #52 | Exceptional 9.7% |
| Tongans | 99.3 /100 | #53 | Exceptional 9.7% |
| Swiss | 99.3 /100 | #54 | Exceptional 9.7% |