South American Indian vs Somali Family Poverty
COMPARE
South American Indian
Somali
Family Poverty
Family Poverty Comparison
South American Indians
Somalis
9.1%
FAMILY POVERTY
38.7/ 100
METRIC RATING
184th/ 347
METRIC RANK
11.2%
FAMILY POVERTY
0.1/ 100
METRIC RATING
273rd/ 347
METRIC RANK
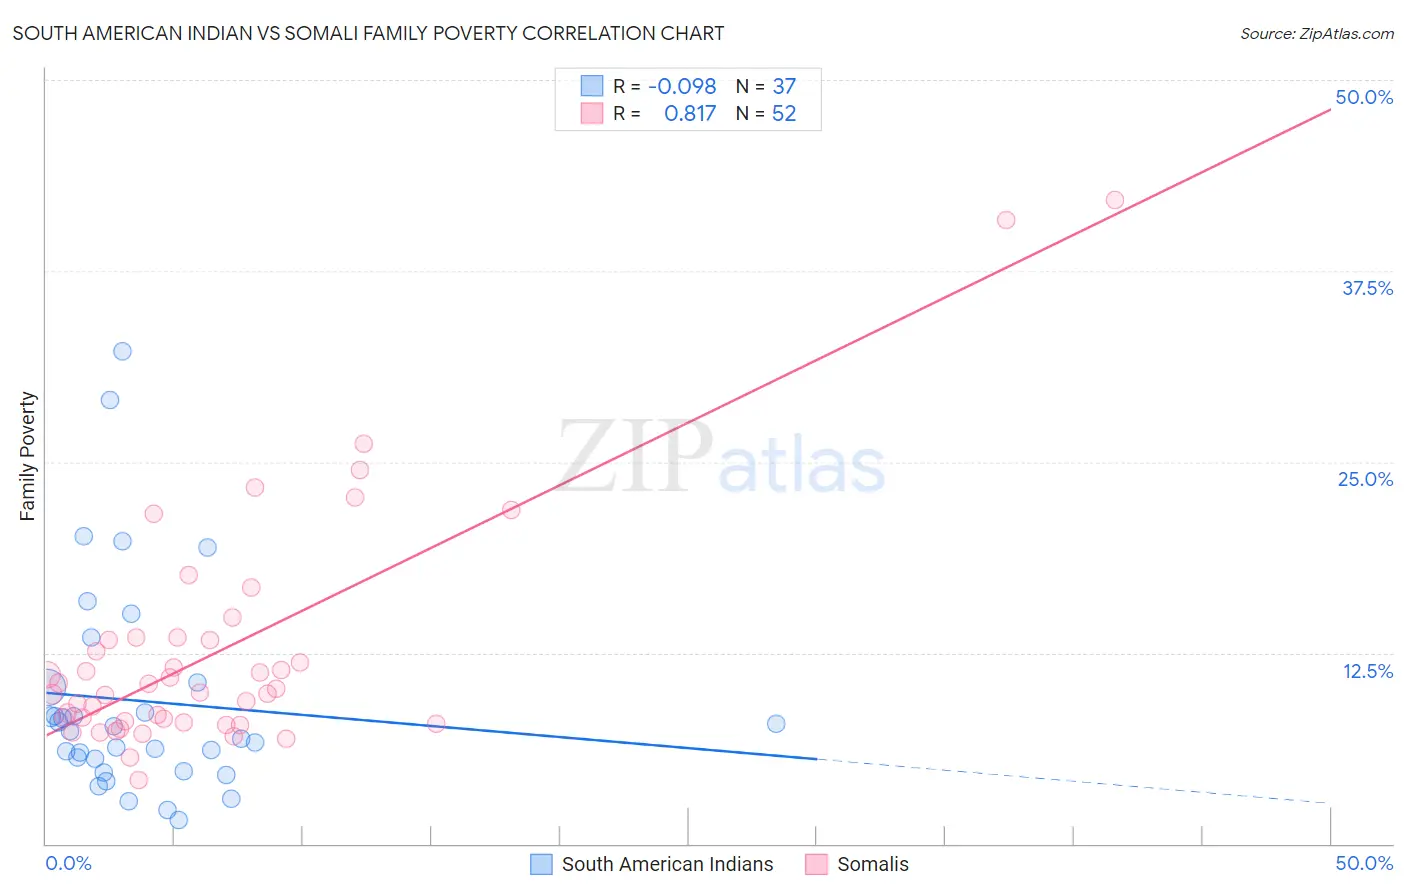
South American Indian vs Somali Family Poverty Correlation Chart
The statistical analysis conducted on geographies consisting of 164,455,459 people shows a slight negative correlation between the proportion of South American Indians and poverty level among families in the United States with a correlation coefficient (R) of -0.098 and weighted average of 9.1%. Similarly, the statistical analysis conducted on geographies consisting of 99,253,282 people shows a very strong positive correlation between the proportion of Somalis and poverty level among families in the United States with a correlation coefficient (R) of 0.817 and weighted average of 11.2%, a difference of 22.6%.
Family Poverty Correlation Summary
| Measurement | South American Indian | Somali |
| Minimum | 1.6% | 4.2% |
| Maximum | 32.2% | 42.2% |
| Range | 30.7% | 38.0% |
| Mean | 9.3% | 12.6% |
| Median | 7.4% | 10.0% |
| Interquartile 25% (IQ1) | 5.1% | 8.0% |
| Interquartile 75% (IQ3) | 10.4% | 13.4% |
| Interquartile Range (IQR) | 5.2% | 5.5% |
| Standard Deviation (Sample) | 7.0% | 7.7% |
| Standard Deviation (Population) | 6.9% | 7.7% |
Similar Demographics by Family Poverty
Demographics Similar to South American Indians by Family Poverty
In terms of family poverty, the demographic groups most similar to South American Indians are Immigrants from Saudi Arabia (9.1%, a difference of 0.010%), Uruguayan (9.1%, a difference of 0.070%), Immigrants from Morocco (9.1%, a difference of 0.20%), Hmong (9.1%, a difference of 0.21%), and Colombian (9.2%, a difference of 0.36%).
| Demographics | Rating | Rank | Family Poverty |
| Hawaiians | 47.2 /100 | #177 | Average 9.0% |
| Immigrants | Cameroon | 47.1 /100 | #178 | Average 9.0% |
| Immigrants | Iraq | 44.4 /100 | #179 | Average 9.1% |
| Immigrants | Uganda | 43.4 /100 | #180 | Average 9.1% |
| Hmong | 40.2 /100 | #181 | Average 9.1% |
| Immigrants | Morocco | 40.2 /100 | #182 | Average 9.1% |
| Uruguayans | 39.2 /100 | #183 | Fair 9.1% |
| South American Indians | 38.7 /100 | #184 | Fair 9.1% |
| Immigrants | Saudi Arabia | 38.6 /100 | #185 | Fair 9.1% |
| Colombians | 36.1 /100 | #186 | Fair 9.2% |
| Delaware | 35.4 /100 | #187 | Fair 9.2% |
| Immigrants | Kenya | 34.0 /100 | #188 | Fair 9.2% |
| Immigrants | Afghanistan | 32.1 /100 | #189 | Fair 9.2% |
| Arabs | 31.5 /100 | #190 | Fair 9.2% |
| Ugandans | 28.7 /100 | #191 | Fair 9.3% |
Demographics Similar to Somalis by Family Poverty
In terms of family poverty, the demographic groups most similar to Somalis are Spanish American (11.2%, a difference of 0.090%), Central American (11.2%, a difference of 0.13%), Immigrants from Guyana (11.2%, a difference of 0.16%), Chippewa (11.2%, a difference of 0.25%), and Guyanese (11.2%, a difference of 0.28%).
| Demographics | Rating | Rank | Family Poverty |
| Immigrants | El Salvador | 0.1 /100 | #266 | Tragic 11.0% |
| Comanche | 0.1 /100 | #267 | Tragic 11.0% |
| Jamaicans | 0.1 /100 | #268 | Tragic 11.1% |
| Immigrants | Ecuador | 0.1 /100 | #269 | Tragic 11.1% |
| Immigrants | Nicaragua | 0.1 /100 | #270 | Tragic 11.1% |
| Immigrants | Bahamas | 0.1 /100 | #271 | Tragic 11.1% |
| Immigrants | Jamaica | 0.1 /100 | #272 | Tragic 11.2% |
| Somalis | 0.1 /100 | #273 | Tragic 11.2% |
| Spanish Americans | 0.1 /100 | #274 | Tragic 11.2% |
| Central Americans | 0.1 /100 | #275 | Tragic 11.2% |
| Immigrants | Guyana | 0.1 /100 | #276 | Tragic 11.2% |
| Chippewa | 0.1 /100 | #277 | Tragic 11.2% |
| Guyanese | 0.1 /100 | #278 | Tragic 11.2% |
| Blackfeet | 0.0 /100 | #279 | Tragic 11.3% |
| Belizeans | 0.0 /100 | #280 | Tragic 11.3% |