Serbian vs Immigrants from South Africa Poverty
COMPARE
Serbian
Immigrants from South Africa
Poverty
Poverty Comparison
Serbians
Immigrants from South Africa
11.2%
POVERTY
97.4/ 100
METRIC RATING
69th/ 347
METRIC RANK
11.5%
POVERTY
94.7/ 100
METRIC RATING
96th/ 347
METRIC RANK
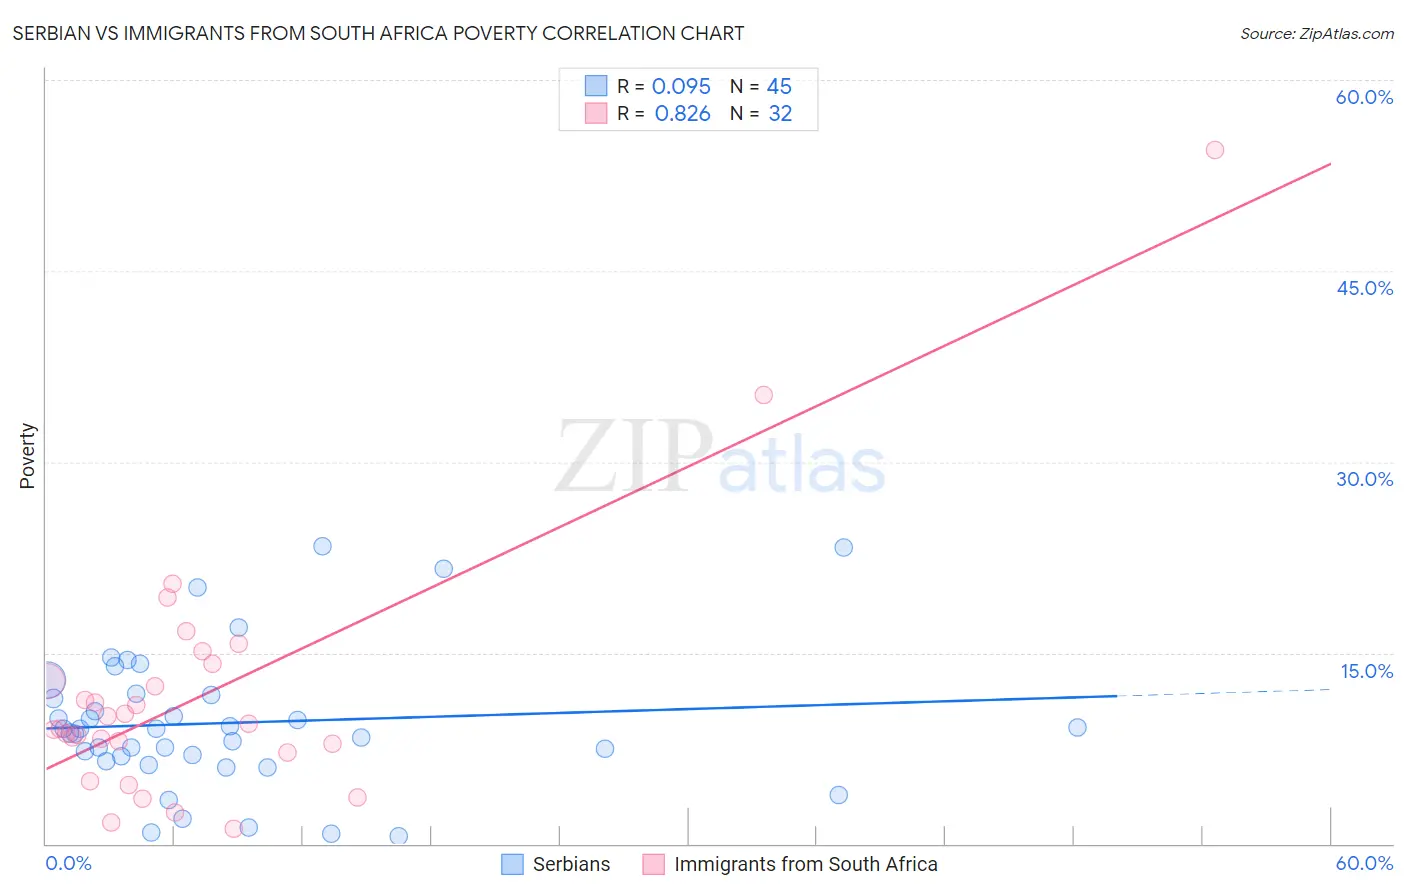
Serbian vs Immigrants from South Africa Poverty Correlation Chart
The statistical analysis conducted on geographies consisting of 267,537,143 people shows a slight positive correlation between the proportion of Serbians and poverty level in the United States with a correlation coefficient (R) of 0.095 and weighted average of 11.2%. Similarly, the statistical analysis conducted on geographies consisting of 233,262,094 people shows a very strong positive correlation between the proportion of Immigrants from South Africa and poverty level in the United States with a correlation coefficient (R) of 0.826 and weighted average of 11.5%, a difference of 1.9%.
Poverty Correlation Summary
| Measurement | Serbian | Immigrants from South Africa |
| Minimum | 0.55% | 1.2% |
| Maximum | 23.4% | 54.5% |
| Range | 22.8% | 53.4% |
| Mean | 9.5% | 11.8% |
| Median | 9.0% | 9.3% |
| Interquartile 25% (IQ1) | 6.7% | 7.5% |
| Interquartile 75% (IQ3) | 11.7% | 13.4% |
| Interquartile Range (IQR) | 5.0% | 5.9% |
| Standard Deviation (Sample) | 5.5% | 10.2% |
| Standard Deviation (Population) | 5.4% | 10.0% |
Similar Demographics by Poverty
Demographics Similar to Serbians by Poverty
In terms of poverty, the demographic groups most similar to Serbians are Slovak (11.2%, a difference of 0.060%), Immigrants from Australia (11.2%, a difference of 0.080%), Immigrants from Canada (11.3%, a difference of 0.090%), Zimbabwean (11.3%, a difference of 0.11%), and Immigrants from Netherlands (11.2%, a difference of 0.12%).
| Demographics | Rating | Rank | Poverty |
| Austrians | 97.8 /100 | #62 | Exceptional 11.2% |
| Ukrainians | 97.8 /100 | #63 | Exceptional 11.2% |
| Swiss | 97.7 /100 | #64 | Exceptional 11.2% |
| Immigrants | Asia | 97.5 /100 | #65 | Exceptional 11.2% |
| Immigrants | Netherlands | 97.5 /100 | #66 | Exceptional 11.2% |
| Immigrants | Australia | 97.4 /100 | #67 | Exceptional 11.2% |
| Slovaks | 97.4 /100 | #68 | Exceptional 11.2% |
| Serbians | 97.4 /100 | #69 | Exceptional 11.2% |
| Immigrants | Canada | 97.3 /100 | #70 | Exceptional 11.3% |
| Zimbabweans | 97.3 /100 | #71 | Exceptional 11.3% |
| Europeans | 97.2 /100 | #72 | Exceptional 11.3% |
| Immigrants | Belgium | 97.2 /100 | #73 | Exceptional 11.3% |
| Carpatho Rusyns | 97.2 /100 | #74 | Exceptional 11.3% |
| Immigrants | Eastern Europe | 97.0 /100 | #75 | Exceptional 11.3% |
| Immigrants | North America | 96.8 /100 | #76 | Exceptional 11.3% |
Demographics Similar to Immigrants from South Africa by Poverty
In terms of poverty, the demographic groups most similar to Immigrants from South Africa are Immigrants from Egypt (11.5%, a difference of 0.030%), Immigrants from Latvia (11.5%, a difference of 0.070%), Paraguayan (11.4%, a difference of 0.12%), Australian (11.4%, a difference of 0.12%), and Romanian (11.4%, a difference of 0.14%).
| Demographics | Rating | Rank | Poverty |
| Czechoslovakians | 95.7 /100 | #89 | Exceptional 11.4% |
| Immigrants | Denmark | 95.5 /100 | #90 | Exceptional 11.4% |
| Finns | 95.2 /100 | #91 | Exceptional 11.4% |
| British | 95.0 /100 | #92 | Exceptional 11.4% |
| Romanians | 94.9 /100 | #93 | Exceptional 11.4% |
| Paraguayans | 94.9 /100 | #94 | Exceptional 11.4% |
| Australians | 94.9 /100 | #95 | Exceptional 11.4% |
| Immigrants | South Africa | 94.7 /100 | #96 | Exceptional 11.5% |
| Immigrants | Egypt | 94.6 /100 | #97 | Exceptional 11.5% |
| Immigrants | Latvia | 94.5 /100 | #98 | Exceptional 11.5% |
| Immigrants | Indonesia | 94.2 /100 | #99 | Exceptional 11.5% |
| Scottish | 94.0 /100 | #100 | Exceptional 11.5% |
| Slavs | 93.3 /100 | #101 | Exceptional 11.5% |
| Laotians | 92.4 /100 | #102 | Exceptional 11.6% |
| Okinawans | 92.4 /100 | #103 | Exceptional 11.6% |