Sudanese vs Iraqi Child Poverty Under the Age of 16
COMPARE
Sudanese
Iraqi
Child Poverty Under the Age of 16
Child Poverty Under the Age of 16 Comparison
Sudanese
Iraqis
18.5%
CHILD POVERTY UNDER THE AGE OF 16
0.9/ 100
METRIC RATING
237th/ 347
METRIC RANK
17.5%
CHILD POVERTY UNDER THE AGE OF 16
5.9/ 100
METRIC RATING
214th/ 347
METRIC RANK
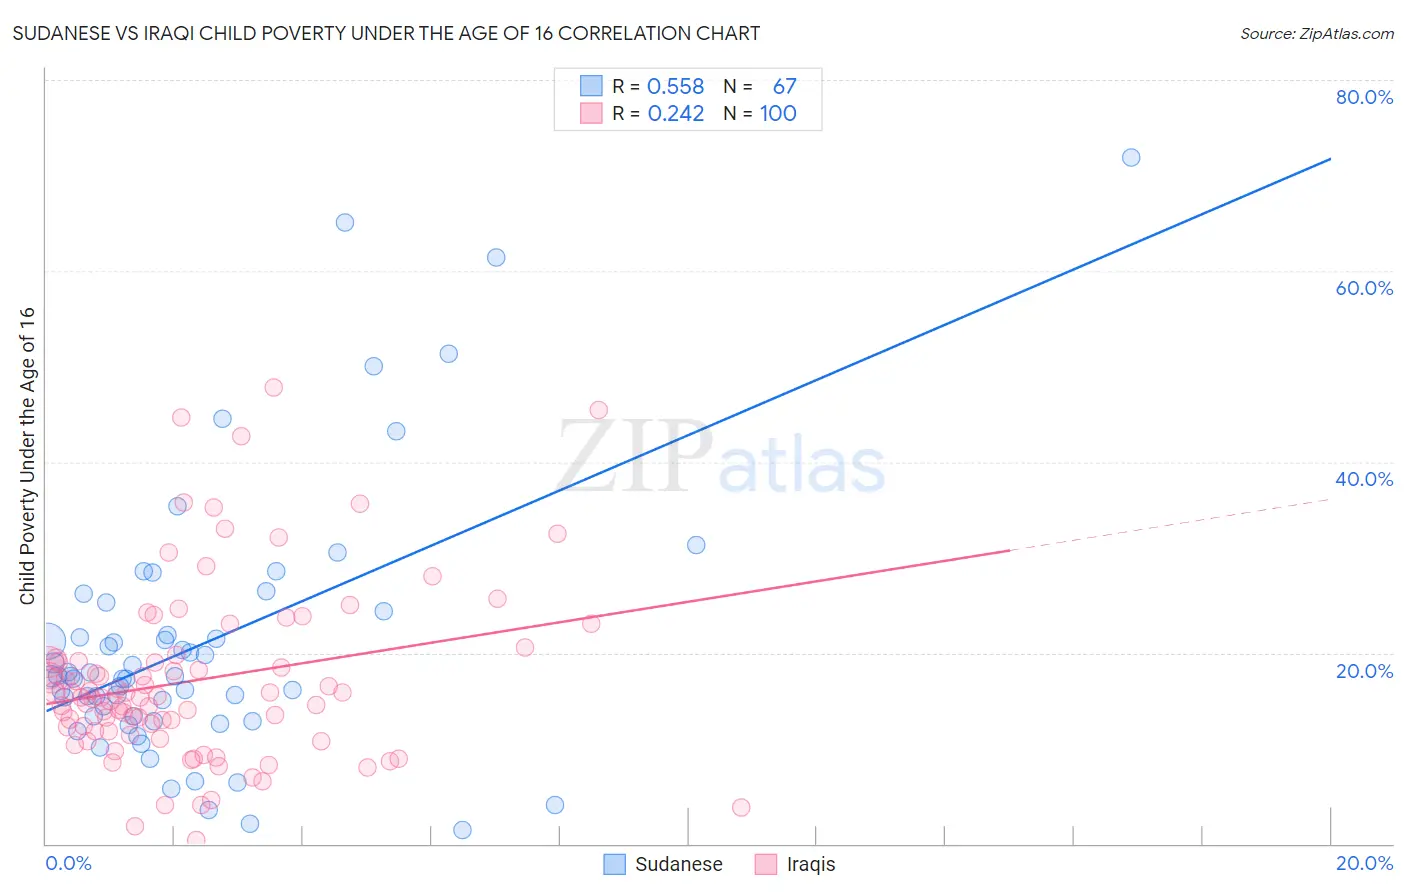
Sudanese vs Iraqi Child Poverty Under the Age of 16 Correlation Chart
The statistical analysis conducted on geographies consisting of 109,977,146 people shows a substantial positive correlation between the proportion of Sudanese and poverty level among children under the age of 16 in the United States with a correlation coefficient (R) of 0.558 and weighted average of 18.5%. Similarly, the statistical analysis conducted on geographies consisting of 170,217,272 people shows a weak positive correlation between the proportion of Iraqis and poverty level among children under the age of 16 in the United States with a correlation coefficient (R) of 0.242 and weighted average of 17.5%, a difference of 5.4%.
Child Poverty Under the Age of 16 Correlation Summary
| Measurement | Sudanese | Iraqi |
| Minimum | 1.5% | 0.44% |
| Maximum | 71.9% | 47.7% |
| Range | 70.4% | 47.3% |
| Mean | 21.0% | 17.2% |
| Median | 17.5% | 15.4% |
| Interquartile 25% (IQ1) | 13.3% | 11.8% |
| Interquartile 75% (IQ3) | 24.4% | 19.2% |
| Interquartile Range (IQR) | 11.1% | 7.4% |
| Standard Deviation (Sample) | 14.0% | 9.3% |
| Standard Deviation (Population) | 13.9% | 9.2% |
Similar Demographics by Child Poverty Under the Age of 16
Demographics Similar to Sudanese by Child Poverty Under the Age of 16
In terms of child poverty under the age of 16, the demographic groups most similar to Sudanese are Cree (18.5%, a difference of 0.030%), Immigrants from Eritrea (18.5%, a difference of 0.24%), Immigrants from Sudan (18.5%, a difference of 0.28%), Nigerian (18.4%, a difference of 0.32%), and Ghanaian (18.6%, a difference of 0.33%).
| Demographics | Rating | Rank | Child Poverty Under the Age of 16 |
| Nepalese | 1.7 /100 | #230 | Tragic 18.2% |
| Nicaraguans | 1.7 /100 | #231 | Tragic 18.2% |
| Americans | 1.2 /100 | #232 | Tragic 18.3% |
| Fijians | 1.1 /100 | #233 | Tragic 18.4% |
| Immigrants | Nigeria | 1.0 /100 | #234 | Tragic 18.4% |
| Nigerians | 1.0 /100 | #235 | Tragic 18.4% |
| Cree | 0.9 /100 | #236 | Tragic 18.5% |
| Sudanese | 0.9 /100 | #237 | Tragic 18.5% |
| Immigrants | Eritrea | 0.8 /100 | #238 | Tragic 18.5% |
| Immigrants | Sudan | 0.8 /100 | #239 | Tragic 18.5% |
| Ghanaians | 0.8 /100 | #240 | Tragic 18.6% |
| Alsatians | 0.7 /100 | #241 | Tragic 18.6% |
| Immigrants | Laos | 0.6 /100 | #242 | Tragic 18.7% |
| Immigrants | Cuba | 0.6 /100 | #243 | Tragic 18.7% |
| Cape Verdeans | 0.6 /100 | #244 | Tragic 18.7% |
Demographics Similar to Iraqis by Child Poverty Under the Age of 16
In terms of child poverty under the age of 16, the demographic groups most similar to Iraqis are Malaysian (17.5%, a difference of 0.020%), Immigrants from the Azores (17.5%, a difference of 0.12%), Sierra Leonean (17.6%, a difference of 0.13%), Immigrants (17.5%, a difference of 0.29%), and Immigrants from Thailand (17.5%, a difference of 0.31%).
| Demographics | Rating | Rank | Child Poverty Under the Age of 16 |
| German Russians | 8.6 /100 | #207 | Tragic 17.4% |
| Pennsylvania Germans | 7.5 /100 | #208 | Tragic 17.4% |
| Panamanians | 6.9 /100 | #209 | Tragic 17.5% |
| Alaskan Athabascans | 6.9 /100 | #210 | Tragic 17.5% |
| Immigrants | Thailand | 6.6 /100 | #211 | Tragic 17.5% |
| Immigrants | Immigrants | 6.5 /100 | #212 | Tragic 17.5% |
| Immigrants | Azores | 6.2 /100 | #213 | Tragic 17.5% |
| Iraqis | 5.9 /100 | #214 | Tragic 17.5% |
| Malaysians | 5.9 /100 | #215 | Tragic 17.5% |
| Sierra Leoneans | 5.7 /100 | #216 | Tragic 17.6% |
| Immigrants | Eastern Africa | 5.3 /100 | #217 | Tragic 17.6% |
| Moroccans | 5.3 /100 | #218 | Tragic 17.6% |
| Japanese | 4.7 /100 | #219 | Tragic 17.7% |
| Immigrants | Panama | 4.1 /100 | #220 | Tragic 17.7% |
| Cubans | 3.7 /100 | #221 | Tragic 17.8% |