Samoan vs Salvadoran Child Poverty Under the Age of 16
COMPARE
Samoan
Salvadoran
Child Poverty Under the Age of 16
Child Poverty Under the Age of 16 Comparison
Samoans
Salvadorans
15.6%
CHILD POVERTY UNDER THE AGE OF 16
77.3/ 100
METRIC RATING
154th/ 347
METRIC RANK
19.1%
CHILD POVERTY UNDER THE AGE OF 16
0.3/ 100
METRIC RATING
253rd/ 347
METRIC RANK
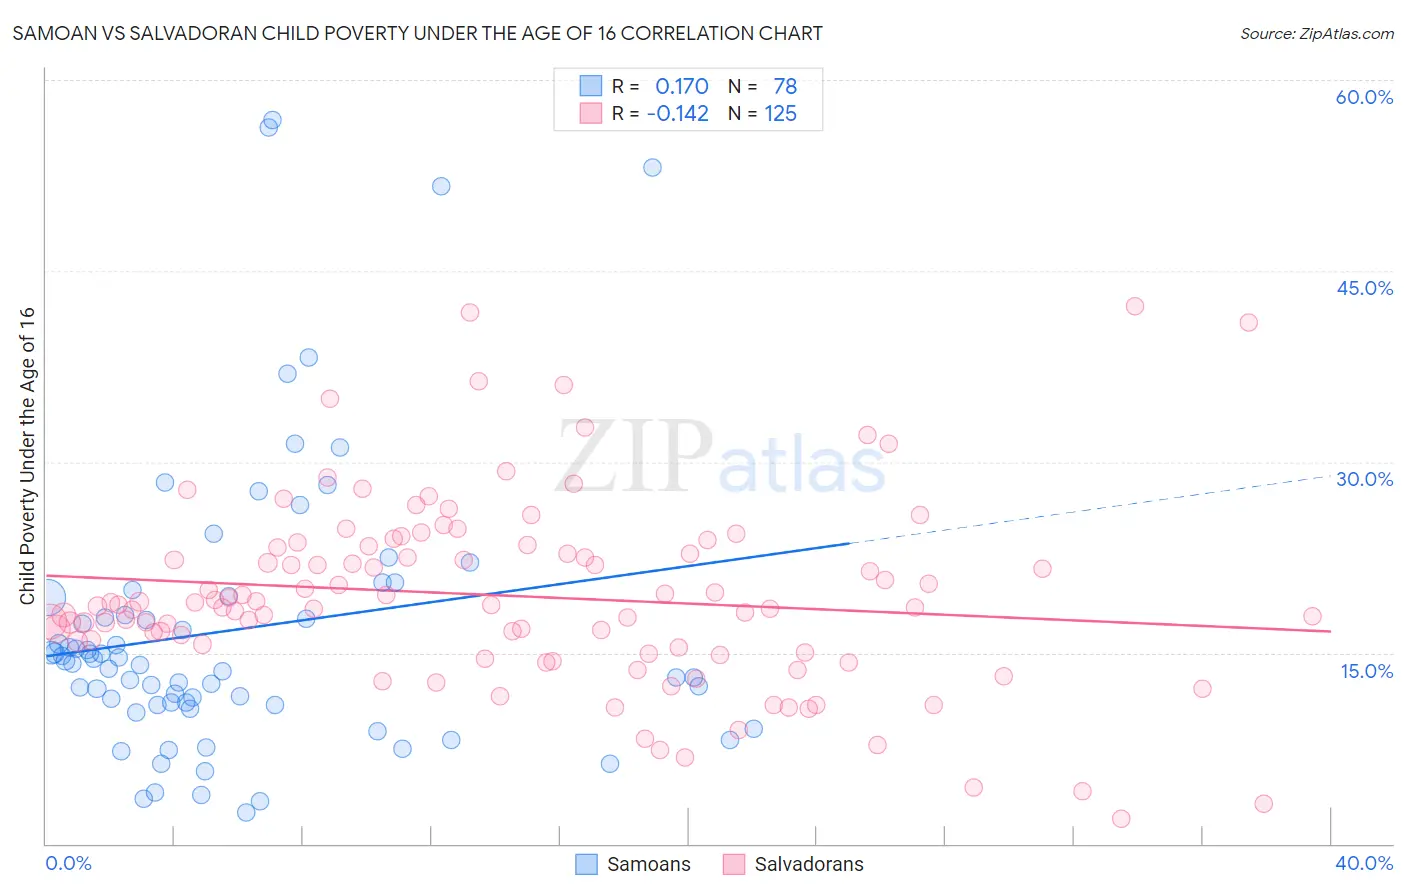
Samoan vs Salvadoran Child Poverty Under the Age of 16 Correlation Chart
The statistical analysis conducted on geographies consisting of 224,526,833 people shows a poor positive correlation between the proportion of Samoans and poverty level among children under the age of 16 in the United States with a correlation coefficient (R) of 0.170 and weighted average of 15.6%. Similarly, the statistical analysis conducted on geographies consisting of 396,509,971 people shows a poor negative correlation between the proportion of Salvadorans and poverty level among children under the age of 16 in the United States with a correlation coefficient (R) of -0.142 and weighted average of 19.1%, a difference of 22.4%.
Child Poverty Under the Age of 16 Correlation Summary
| Measurement | Samoan | Salvadoran |
| Minimum | 2.5% | 1.9% |
| Maximum | 56.8% | 42.2% |
| Range | 54.4% | 40.3% |
| Mean | 16.9% | 19.5% |
| Median | 14.3% | 18.8% |
| Interquartile 25% (IQ1) | 10.9% | 15.2% |
| Interquartile 75% (IQ3) | 19.4% | 23.3% |
| Interquartile Range (IQR) | 8.5% | 8.1% |
| Standard Deviation (Sample) | 11.4% | 7.4% |
| Standard Deviation (Population) | 11.4% | 7.3% |
Similar Demographics by Child Poverty Under the Age of 16
Demographics Similar to Samoans by Child Poverty Under the Age of 16
In terms of child poverty under the age of 16, the demographic groups most similar to Samoans are Venezuelan (15.6%, a difference of 0.030%), French Canadian (15.6%, a difference of 0.18%), Syrian (15.6%, a difference of 0.21%), Immigrants from Jordan (15.6%, a difference of 0.22%), and French (15.6%, a difference of 0.22%).
| Demographics | Rating | Rank | Child Poverty Under the Age of 16 |
| Immigrants | Kuwait | 80.5 /100 | #147 | Excellent 15.5% |
| Puget Sound Salish | 80.3 /100 | #148 | Excellent 15.5% |
| Israelis | 80.1 /100 | #149 | Excellent 15.5% |
| Immigrants | Jordan | 78.5 /100 | #150 | Good 15.6% |
| French | 78.5 /100 | #151 | Good 15.6% |
| French Canadians | 78.2 /100 | #152 | Good 15.6% |
| Venezuelans | 77.4 /100 | #153 | Good 15.6% |
| Samoans | 77.3 /100 | #154 | Good 15.6% |
| Syrians | 76.1 /100 | #155 | Good 15.6% |
| Immigrants | Venezuela | 74.9 /100 | #156 | Good 15.7% |
| Immigrants | Nepal | 72.9 /100 | #157 | Good 15.7% |
| Immigrants | Chile | 72.8 /100 | #158 | Good 15.7% |
| Immigrants | Fiji | 71.1 /100 | #159 | Good 15.8% |
| Immigrants | Albania | 70.7 /100 | #160 | Good 15.8% |
| Immigrants | Northern Africa | 68.1 /100 | #161 | Good 15.8% |
Demographics Similar to Salvadorans by Child Poverty Under the Age of 16
In terms of child poverty under the age of 16, the demographic groups most similar to Salvadorans are Immigrants from Trinidad and Tobago (19.1%, a difference of 0.19%), Immigrants from Western Africa (19.2%, a difference of 0.25%), Immigrants from Ghana (19.1%, a difference of 0.26%), Immigrants from Middle Africa (19.0%, a difference of 0.42%), and Trinidadian and Tobagonian (19.2%, a difference of 0.42%).
| Demographics | Rating | Rank | Child Poverty Under the Age of 16 |
| Immigrants | Nicaragua | 0.4 /100 | #246 | Tragic 18.8% |
| French American Indians | 0.4 /100 | #247 | Tragic 18.9% |
| Ecuadorians | 0.3 /100 | #248 | Tragic 19.0% |
| Potawatomi | 0.3 /100 | #249 | Tragic 19.0% |
| Immigrants | Middle Africa | 0.3 /100 | #250 | Tragic 19.0% |
| Immigrants | Ghana | 0.3 /100 | #251 | Tragic 19.1% |
| Immigrants | Trinidad and Tobago | 0.3 /100 | #252 | Tragic 19.1% |
| Salvadorans | 0.3 /100 | #253 | Tragic 19.1% |
| Immigrants | Western Africa | 0.2 /100 | #254 | Tragic 19.2% |
| Trinidadians and Tobagonians | 0.2 /100 | #255 | Tragic 19.2% |
| Inupiat | 0.2 /100 | #256 | Tragic 19.2% |
| Ottawa | 0.2 /100 | #257 | Tragic 19.2% |
| Spanish Americans | 0.2 /100 | #258 | Tragic 19.2% |
| Mexican American Indians | 0.2 /100 | #259 | Tragic 19.3% |
| Guyanese | 0.2 /100 | #260 | Tragic 19.3% |