Salvadoran vs Swiss Female Poverty Among 25-34 Year Olds
COMPARE
Salvadoran
Swiss
Female Poverty Among 25-34 Year Olds
Female Poverty Among 25-34 Year Olds Comparison
Salvadorans
Swiss
14.7%
FEMALE POVERTY AMONG 25-34 YEAR OLDS
1.4/ 100
METRIC RATING
236th/ 347
METRIC RANK
13.4%
FEMALE POVERTY AMONG 25-34 YEAR OLDS
61.7/ 100
METRIC RATING
164th/ 347
METRIC RANK
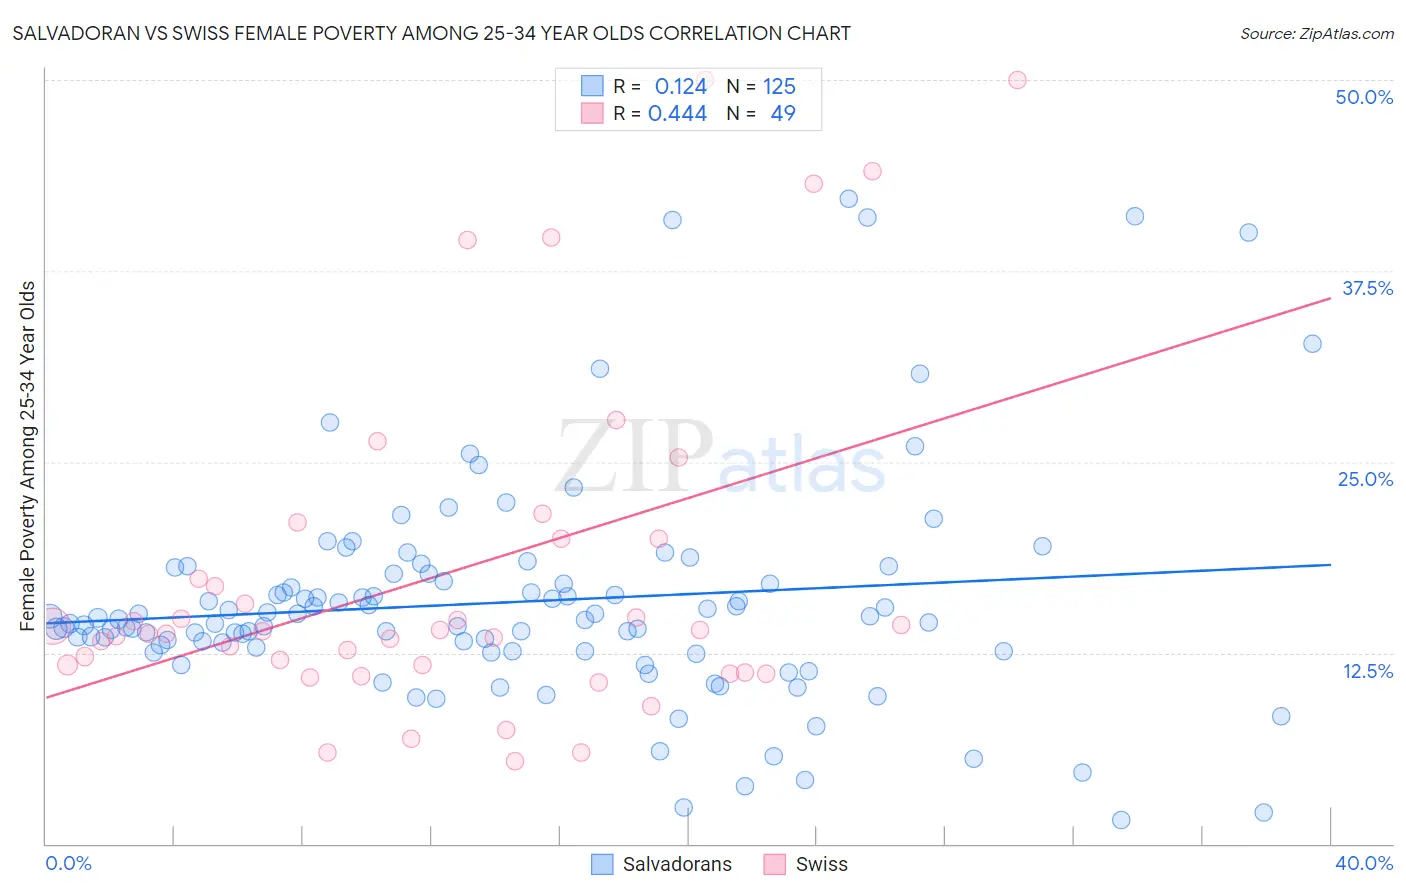
Salvadoran vs Swiss Female Poverty Among 25-34 Year Olds Correlation Chart
The statistical analysis conducted on geographies consisting of 394,044,278 people shows a poor positive correlation between the proportion of Salvadorans and poverty level among females between the ages 25 and 34 in the United States with a correlation coefficient (R) of 0.124 and weighted average of 14.7%. Similarly, the statistical analysis conducted on geographies consisting of 452,860,675 people shows a moderate positive correlation between the proportion of Swiss and poverty level among females between the ages 25 and 34 in the United States with a correlation coefficient (R) of 0.444 and weighted average of 13.4%, a difference of 9.9%.
Female Poverty Among 25-34 Year Olds Correlation Summary
| Measurement | Salvadoran | Swiss |
| Minimum | 1.5% | 5.4% |
| Maximum | 42.2% | 50.0% |
| Range | 40.7% | 44.6% |
| Mean | 15.8% | 17.7% |
| Median | 14.7% | 13.9% |
| Interquartile 25% (IQ1) | 12.6% | 11.4% |
| Interquartile 75% (IQ3) | 17.4% | 20.0% |
| Interquartile Range (IQR) | 4.8% | 8.6% |
| Standard Deviation (Sample) | 7.4% | 11.2% |
| Standard Deviation (Population) | 7.3% | 11.1% |
Similar Demographics by Female Poverty Among 25-34 Year Olds
Demographics Similar to Salvadorans by Female Poverty Among 25-34 Year Olds
In terms of female poverty among 25-34 year olds, the demographic groups most similar to Salvadorans are Immigrants from Ghana (14.7%, a difference of 0.0%), Immigrants from Jamaica (14.7%, a difference of 0.020%), Alsatian (14.7%, a difference of 0.040%), Malaysian (14.7%, a difference of 0.070%), and Immigrants from Grenada (14.7%, a difference of 0.12%).
| Demographics | Rating | Rank | Female Poverty Among 25-34 Year Olds |
| Spanish | 2.5 /100 | #229 | Tragic 14.6% |
| Spaniards | 2.3 /100 | #230 | Tragic 14.6% |
| Delaware | 2.3 /100 | #231 | Tragic 14.6% |
| Immigrants | Ecuador | 1.9 /100 | #232 | Tragic 14.6% |
| Whites/Caucasians | 1.8 /100 | #233 | Tragic 14.7% |
| Cubans | 1.6 /100 | #234 | Tragic 14.7% |
| Immigrants | Jamaica | 1.4 /100 | #235 | Tragic 14.7% |
| Salvadorans | 1.4 /100 | #236 | Tragic 14.7% |
| Immigrants | Ghana | 1.4 /100 | #237 | Tragic 14.7% |
| Alsatians | 1.4 /100 | #238 | Tragic 14.7% |
| Malaysians | 1.4 /100 | #239 | Tragic 14.7% |
| Immigrants | Grenada | 1.3 /100 | #240 | Tragic 14.7% |
| Scotch-Irish | 1.2 /100 | #241 | Tragic 14.8% |
| Barbadians | 1.2 /100 | #242 | Tragic 14.8% |
| Immigrants | Nicaragua | 1.1 /100 | #243 | Tragic 14.8% |
Demographics Similar to Swiss by Female Poverty Among 25-34 Year Olds
In terms of female poverty among 25-34 year olds, the demographic groups most similar to Swiss are British (13.4%, a difference of 0.16%), Ugandan (13.4%, a difference of 0.21%), Basque (13.4%, a difference of 0.21%), Belgian (13.4%, a difference of 0.24%), and Immigrants from Bosnia and Herzegovina (13.4%, a difference of 0.27%).
| Demographics | Rating | Rank | Female Poverty Among 25-34 Year Olds |
| Immigrants | Western Europe | 70.3 /100 | #157 | Good 13.3% |
| Immigrants | Colombia | 69.2 /100 | #158 | Good 13.3% |
| Uruguayans | 66.9 /100 | #159 | Good 13.3% |
| Immigrants | South America | 66.3 /100 | #160 | Good 13.3% |
| Icelanders | 65.7 /100 | #161 | Good 13.3% |
| Ugandans | 64.1 /100 | #162 | Good 13.4% |
| British | 63.5 /100 | #163 | Good 13.4% |
| Swiss | 61.7 /100 | #164 | Good 13.4% |
| Basques | 59.3 /100 | #165 | Average 13.4% |
| Belgians | 58.9 /100 | #166 | Average 13.4% |
| Immigrants | Bosnia and Herzegovina | 58.6 /100 | #167 | Average 13.4% |
| Immigrants | Afghanistan | 57.7 /100 | #168 | Average 13.4% |
| Samoans | 56.8 /100 | #169 | Average 13.5% |
| Immigrants | Uganda | 53.0 /100 | #170 | Average 13.5% |
| South American Indians | 51.9 /100 | #171 | Average 13.5% |