Immigrants from Ethiopia vs Immigrants from Sweden Female Poverty Among 18-24 Year Olds
COMPARE
Immigrants from Ethiopia
Immigrants from Sweden
Female Poverty Among 18-24 Year Olds
Female Poverty Among 18-24 Year Olds Comparison
Immigrants from Ethiopia
Immigrants from Sweden
20.2%
FEMALE POVERTY AMONG 18-24 YEAR OLDS
37.3/ 100
METRIC RATING
186th/ 347
METRIC RANK
20.7%
FEMALE POVERTY AMONG 18-24 YEAR OLDS
6.8/ 100
METRIC RATING
227th/ 347
METRIC RANK
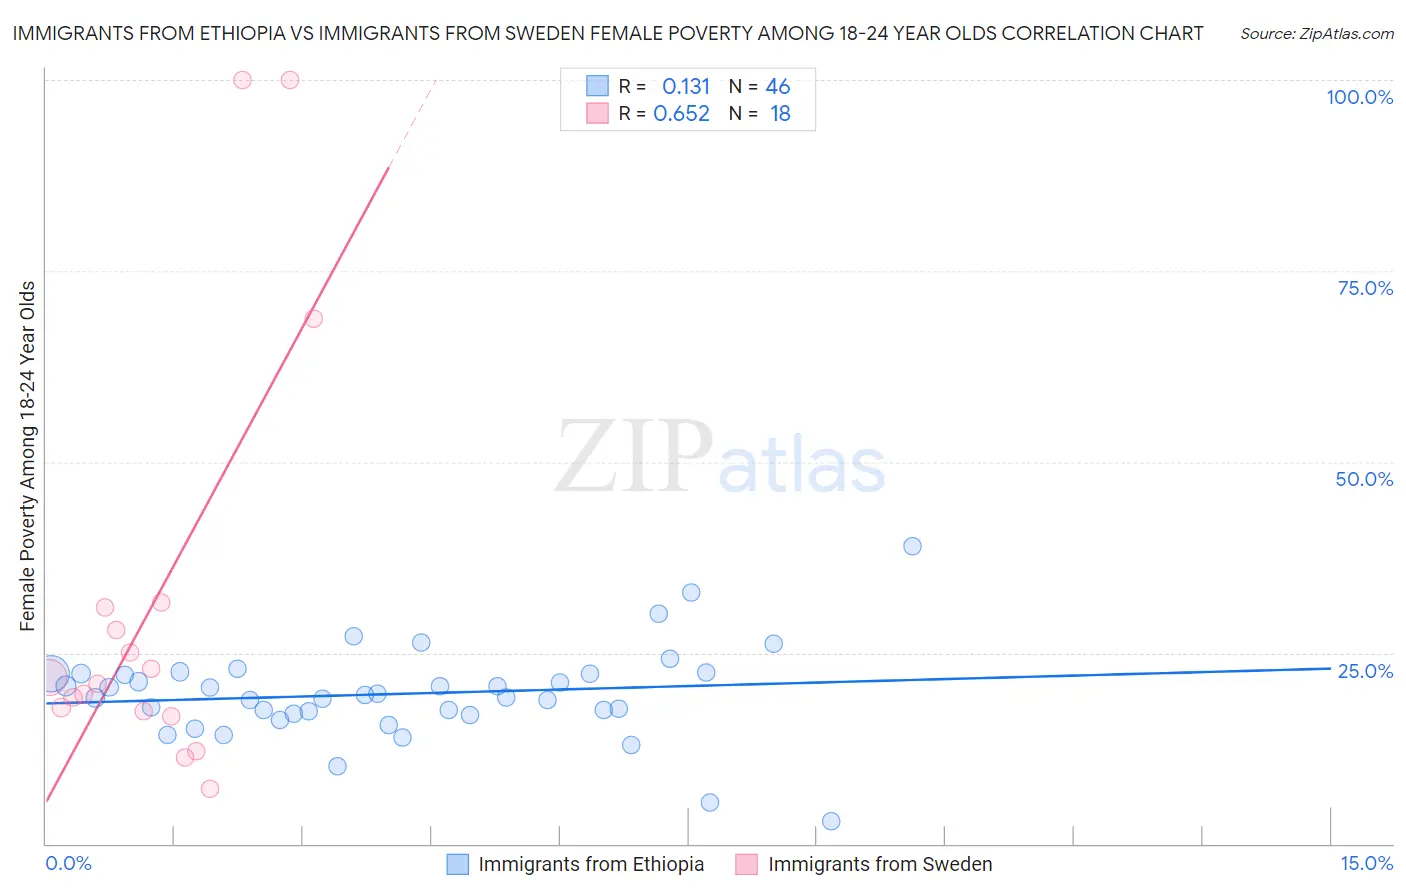
Immigrants from Ethiopia vs Immigrants from Sweden Female Poverty Among 18-24 Year Olds Correlation Chart
The statistical analysis conducted on geographies consisting of 209,579,558 people shows a poor positive correlation between the proportion of Immigrants from Ethiopia and poverty level among females between the ages 18 and 24 in the United States with a correlation coefficient (R) of 0.131 and weighted average of 20.2%. Similarly, the statistical analysis conducted on geographies consisting of 162,147,653 people shows a significant positive correlation between the proportion of Immigrants from Sweden and poverty level among females between the ages 18 and 24 in the United States with a correlation coefficient (R) of 0.652 and weighted average of 20.7%, a difference of 2.5%.
Female Poverty Among 18-24 Year Olds Correlation Summary
| Measurement | Immigrants from Ethiopia | Immigrants from Sweden |
| Minimum | 3.0% | 7.1% |
| Maximum | 39.0% | 100.0% |
| Range | 36.0% | 92.9% |
| Mean | 19.6% | 31.7% |
| Median | 19.3% | 21.3% |
| Interquartile 25% (IQ1) | 17.1% | 17.3% |
| Interquartile 75% (IQ3) | 22.2% | 30.9% |
| Interquartile Range (IQR) | 5.1% | 13.5% |
| Standard Deviation (Sample) | 6.1% | 28.1% |
| Standard Deviation (Population) | 6.1% | 27.3% |
Similar Demographics by Female Poverty Among 18-24 Year Olds
Demographics Similar to Immigrants from Ethiopia by Female Poverty Among 18-24 Year Olds
In terms of female poverty among 18-24 year olds, the demographic groups most similar to Immigrants from Ethiopia are Immigrants from Mexico (20.2%, a difference of 0.050%), Nepalese (20.2%, a difference of 0.12%), Immigrants from Central America (20.2%, a difference of 0.14%), Scandinavian (20.3%, a difference of 0.14%), and Lebanese (20.2%, a difference of 0.17%).
| Demographics | Rating | Rank | Female Poverty Among 18-24 Year Olds |
| Ethiopians | 43.8 /100 | #179 | Average 20.2% |
| Iraqis | 43.3 /100 | #180 | Average 20.2% |
| Immigrants | China | 43.0 /100 | #181 | Average 20.2% |
| Immigrants | Barbados | 42.8 /100 | #182 | Average 20.2% |
| Lebanese | 40.6 /100 | #183 | Average 20.2% |
| Immigrants | Central America | 39.9 /100 | #184 | Fair 20.2% |
| Nepalese | 39.7 /100 | #185 | Fair 20.2% |
| Immigrants | Ethiopia | 37.3 /100 | #186 | Fair 20.2% |
| Immigrants | Mexico | 36.3 /100 | #187 | Fair 20.2% |
| Scandinavians | 34.6 /100 | #188 | Fair 20.3% |
| Immigrants | Germany | 34.0 /100 | #189 | Fair 20.3% |
| Immigrants | Western Asia | 29.3 /100 | #190 | Fair 20.3% |
| Moroccans | 25.8 /100 | #191 | Fair 20.4% |
| Immigrants | Israel | 24.4 /100 | #192 | Fair 20.4% |
| Nigerians | 23.4 /100 | #193 | Fair 20.4% |
Demographics Similar to Immigrants from Sweden by Female Poverty Among 18-24 Year Olds
In terms of female poverty among 18-24 year olds, the demographic groups most similar to Immigrants from Sweden are Ghanaian (20.8%, a difference of 0.060%), Estonian (20.7%, a difference of 0.070%), Norwegian (20.7%, a difference of 0.080%), Australian (20.8%, a difference of 0.13%), and White/Caucasian (20.8%, a difference of 0.13%).
| Demographics | Rating | Rank | Female Poverty Among 18-24 Year Olds |
| British | 9.4 /100 | #220 | Tragic 20.7% |
| Barbadians | 9.0 /100 | #221 | Tragic 20.7% |
| Guatemalans | 8.1 /100 | #222 | Tragic 20.7% |
| French | 7.9 /100 | #223 | Tragic 20.7% |
| Immigrants | Liberia | 7.6 /100 | #224 | Tragic 20.7% |
| Norwegians | 7.3 /100 | #225 | Tragic 20.7% |
| Estonians | 7.2 /100 | #226 | Tragic 20.7% |
| Immigrants | Sweden | 6.8 /100 | #227 | Tragic 20.7% |
| Ghanaians | 6.5 /100 | #228 | Tragic 20.8% |
| Australians | 6.1 /100 | #229 | Tragic 20.8% |
| Whites/Caucasians | 6.1 /100 | #230 | Tragic 20.8% |
| Immigrants | St. Vincent and the Grenadines | 6.0 /100 | #231 | Tragic 20.8% |
| Finns | 6.0 /100 | #232 | Tragic 20.8% |
| Immigrants | Denmark | 5.8 /100 | #233 | Tragic 20.8% |
| Welsh | 5.4 /100 | #234 | Tragic 20.8% |