Immigrants from Eastern Africa vs Australian Single Male Poverty
COMPARE
Immigrants from Eastern Africa
Australian
Single Male Poverty
Single Male Poverty Comparison
Immigrants from Eastern Africa
Australians
12.3%
SINGLE MALE POVERTY
95.0/ 100
METRIC RATING
108th/ 347
METRIC RANK
12.6%
SINGLE MALE POVERTY
71.4/ 100
METRIC RATING
152nd/ 347
METRIC RANK
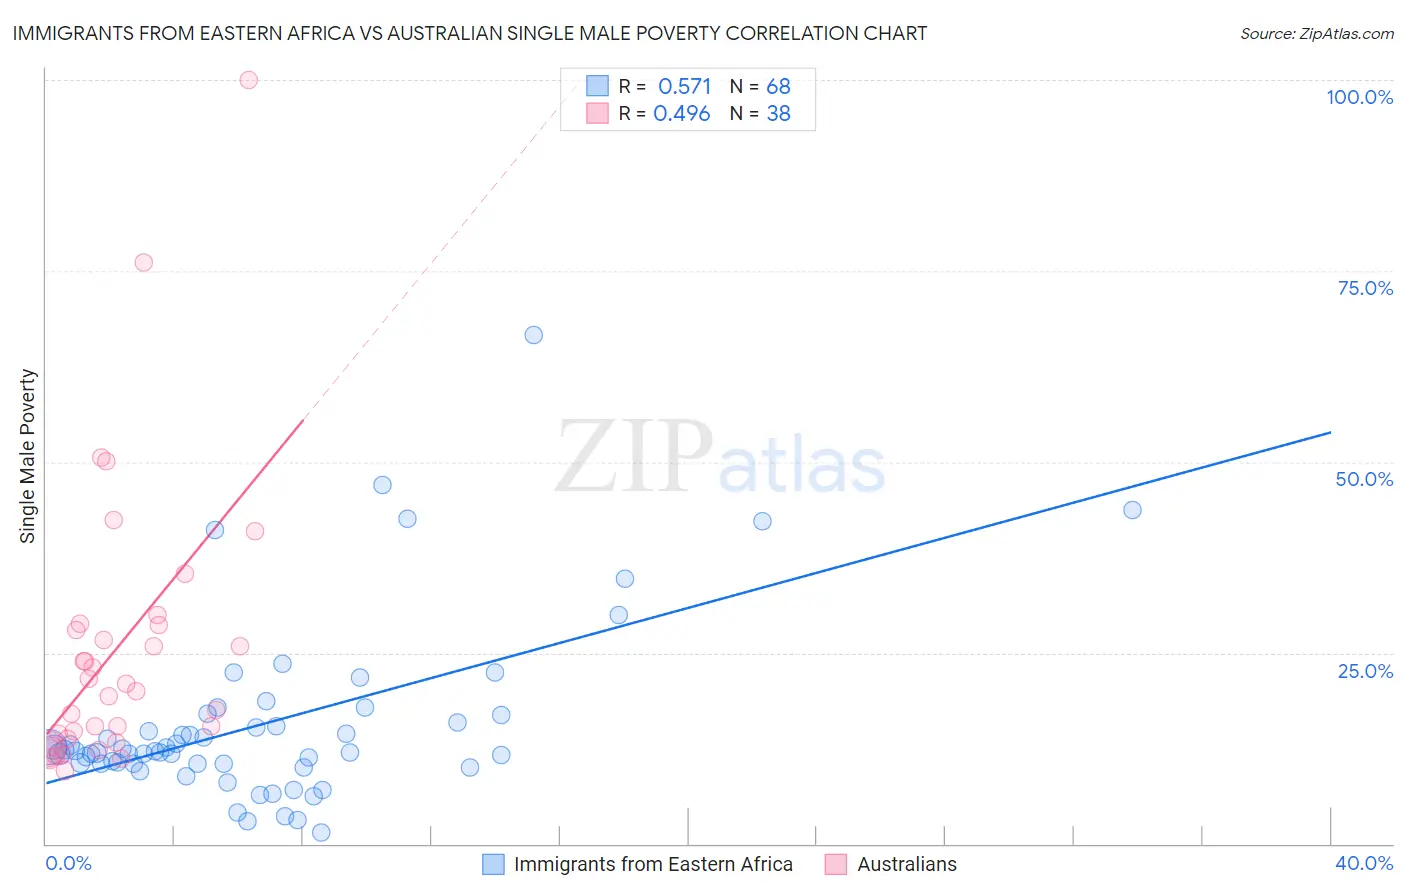
Immigrants from Eastern Africa vs Australian Single Male Poverty Correlation Chart
The statistical analysis conducted on geographies consisting of 319,633,400 people shows a substantial positive correlation between the proportion of Immigrants from Eastern Africa and poverty level among single males in the United States with a correlation coefficient (R) of 0.571 and weighted average of 12.3%. Similarly, the statistical analysis conducted on geographies consisting of 203,982,275 people shows a moderate positive correlation between the proportion of Australians and poverty level among single males in the United States with a correlation coefficient (R) of 0.496 and weighted average of 12.6%, a difference of 2.8%.
Single Male Poverty Correlation Summary
| Measurement | Immigrants from Eastern Africa | Australian |
| Minimum | 1.5% | 9.6% |
| Maximum | 66.7% | 100.0% |
| Range | 65.1% | 90.4% |
| Mean | 15.7% | 25.6% |
| Median | 12.1% | 20.5% |
| Interquartile 25% (IQ1) | 10.5% | 13.8% |
| Interquartile 75% (IQ3) | 16.3% | 28.6% |
| Interquartile Range (IQR) | 5.9% | 14.7% |
| Standard Deviation (Sample) | 11.6% | 18.5% |
| Standard Deviation (Population) | 11.6% | 18.3% |
Similar Demographics by Single Male Poverty
Demographics Similar to Immigrants from Eastern Africa by Single Male Poverty
In terms of single male poverty, the demographic groups most similar to Immigrants from Eastern Africa are Iraqi (12.3%, a difference of 0.020%), Ugandan (12.3%, a difference of 0.13%), Immigrants from Morocco (12.3%, a difference of 0.20%), Jordanian (12.3%, a difference of 0.28%), and Immigrants from Portugal (12.3%, a difference of 0.36%).
| Demographics | Rating | Rank | Single Male Poverty |
| Immigrants | Latvia | 97.0 /100 | #101 | Exceptional 12.2% |
| Immigrants | Europe | 97.0 /100 | #102 | Exceptional 12.2% |
| Immigrants | Armenia | 96.7 /100 | #103 | Exceptional 12.2% |
| Immigrants | Kazakhstan | 96.7 /100 | #104 | Exceptional 12.2% |
| Jordanians | 95.9 /100 | #105 | Exceptional 12.3% |
| Immigrants | Morocco | 95.6 /100 | #106 | Exceptional 12.3% |
| Iraqis | 95.1 /100 | #107 | Exceptional 12.3% |
| Immigrants | Eastern Africa | 95.0 /100 | #108 | Exceptional 12.3% |
| Ugandans | 94.5 /100 | #109 | Exceptional 12.3% |
| Immigrants | Portugal | 93.6 /100 | #110 | Exceptional 12.3% |
| Immigrants | North Macedonia | 93.6 /100 | #111 | Exceptional 12.3% |
| Kenyans | 93.3 /100 | #112 | Exceptional 12.4% |
| Pakistanis | 92.4 /100 | #113 | Exceptional 12.4% |
| Nicaraguans | 92.1 /100 | #114 | Exceptional 12.4% |
| Immigrants | Southern Europe | 91.5 /100 | #115 | Exceptional 12.4% |
Demographics Similar to Australians by Single Male Poverty
In terms of single male poverty, the demographic groups most similar to Australians are Immigrants from Hungary (12.6%, a difference of 0.030%), Immigrants from Panama (12.6%, a difference of 0.050%), Immigrants (12.7%, a difference of 0.080%), Sierra Leonean (12.6%, a difference of 0.11%), and Immigrants from Scotland (12.7%, a difference of 0.16%).
| Demographics | Rating | Rank | Single Male Poverty |
| Immigrants | Lebanon | 75.0 /100 | #145 | Good 12.6% |
| Native Hawaiians | 75.0 /100 | #146 | Good 12.6% |
| Malaysians | 74.8 /100 | #147 | Good 12.6% |
| Yugoslavians | 73.9 /100 | #148 | Good 12.6% |
| Sierra Leoneans | 73.0 /100 | #149 | Good 12.6% |
| Immigrants | Panama | 72.1 /100 | #150 | Good 12.6% |
| Immigrants | Hungary | 71.9 /100 | #151 | Good 12.6% |
| Australians | 71.4 /100 | #152 | Good 12.6% |
| Immigrants | Immigrants | 70.1 /100 | #153 | Good 12.7% |
| Immigrants | Scotland | 68.9 /100 | #154 | Good 12.7% |
| Immigrants | Spain | 68.7 /100 | #155 | Good 12.7% |
| Vietnamese | 67.9 /100 | #156 | Good 12.7% |
| Latvians | 67.9 /100 | #157 | Good 12.7% |
| Immigrants | Middle Africa | 64.9 /100 | #158 | Good 12.7% |
| Immigrants | Liberia | 64.2 /100 | #159 | Good 12.7% |