Pueblo vs Immigrants from St. Vincent and the Grenadines Female Poverty Among 25-34 Year Olds
COMPARE
Pueblo
Immigrants from St. Vincent and the Grenadines
Female Poverty Among 25-34 Year Olds
Female Poverty Among 25-34 Year Olds Comparison
Pueblo
Immigrants from St. Vincent and the Grenadines
22.2%
FEMALE POVERTY AMONG 25-34 YEAR OLDS
0.0/ 100
METRIC RATING
336th/ 347
METRIC RANK
13.8%
FEMALE POVERTY AMONG 25-34 YEAR OLDS
29.3/ 100
METRIC RATING
191st/ 347
METRIC RANK
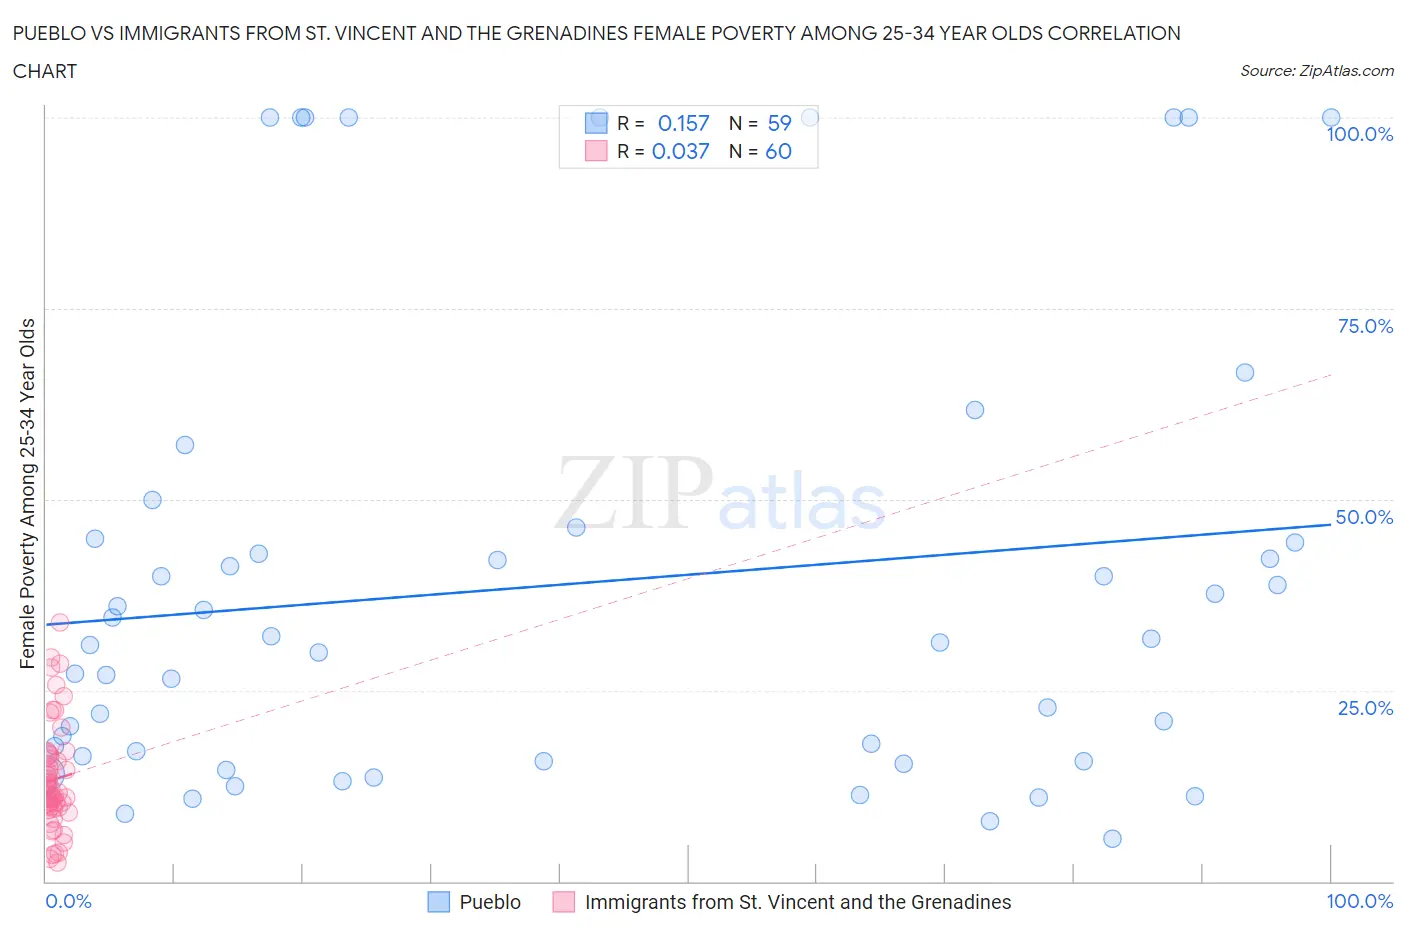
Pueblo vs Immigrants from St. Vincent and the Grenadines Female Poverty Among 25-34 Year Olds Correlation Chart
The statistical analysis conducted on geographies consisting of 119,661,710 people shows a poor positive correlation between the proportion of Pueblo and poverty level among females between the ages 25 and 34 in the United States with a correlation coefficient (R) of 0.157 and weighted average of 22.2%. Similarly, the statistical analysis conducted on geographies consisting of 55,954,264 people shows no correlation between the proportion of Immigrants from St. Vincent and the Grenadines and poverty level among females between the ages 25 and 34 in the United States with a correlation coefficient (R) of 0.037 and weighted average of 13.8%, a difference of 60.9%.
Female Poverty Among 25-34 Year Olds Correlation Summary
| Measurement | Pueblo | Immigrants from St. Vincent and the Grenadines |
| Minimum | 5.6% | 2.4% |
| Maximum | 100.0% | 33.8% |
| Range | 94.4% | 31.4% |
| Mean | 38.9% | 13.3% |
| Median | 31.2% | 11.6% |
| Interquartile 25% (IQ1) | 15.8% | 9.8% |
| Interquartile 75% (IQ3) | 44.9% | 16.3% |
| Interquartile Range (IQR) | 29.1% | 6.6% |
| Standard Deviation (Sample) | 29.6% | 6.8% |
| Standard Deviation (Population) | 29.3% | 6.7% |
Similar Demographics by Female Poverty Among 25-34 Year Olds
Demographics Similar to Pueblo by Female Poverty Among 25-34 Year Olds
In terms of female poverty among 25-34 year olds, the demographic groups most similar to Pueblo are Crow (22.7%, a difference of 2.3%), Houma (22.7%, a difference of 2.5%), Yuman (22.9%, a difference of 3.4%), Sioux (23.0%, a difference of 3.5%), and Navajo (23.3%, a difference of 5.3%).
| Demographics | Rating | Rank | Female Poverty Among 25-34 Year Olds |
| Creek | 0.0 /100 | #329 | Tragic 19.2% |
| Paiute | 0.0 /100 | #330 | Tragic 19.6% |
| Kiowa | 0.0 /100 | #331 | Tragic 19.7% |
| Immigrants | Yemen | 0.0 /100 | #332 | Tragic 19.8% |
| Cajuns | 0.0 /100 | #333 | Tragic 19.9% |
| Apache | 0.0 /100 | #334 | Tragic 20.1% |
| Natives/Alaskans | 0.0 /100 | #335 | Tragic 20.3% |
| Pueblo | 0.0 /100 | #336 | Tragic 22.2% |
| Crow | 0.0 /100 | #337 | Tragic 22.7% |
| Houma | 0.0 /100 | #338 | Tragic 22.7% |
| Yuman | 0.0 /100 | #339 | Tragic 22.9% |
| Sioux | 0.0 /100 | #340 | Tragic 23.0% |
| Navajo | 0.0 /100 | #341 | Tragic 23.3% |
| Hopi | 0.0 /100 | #342 | Tragic 23.7% |
| Yup'ik | 0.0 /100 | #343 | Tragic 24.3% |
Demographics Similar to Immigrants from St. Vincent and the Grenadines by Female Poverty Among 25-34 Year Olds
In terms of female poverty among 25-34 year olds, the demographic groups most similar to Immigrants from St. Vincent and the Grenadines are Dutch (13.8%, a difference of 0.040%), Tlingit-Haida (13.8%, a difference of 0.12%), Immigrants from Kenya (13.8%, a difference of 0.14%), Finnish (13.7%, a difference of 0.30%), and Immigrants from Eritrea (13.7%, a difference of 0.32%).
| Demographics | Rating | Rank | Female Poverty Among 25-34 Year Olds |
| Czechoslovakians | 36.8 /100 | #184 | Fair 13.7% |
| Irish | 35.3 /100 | #185 | Fair 13.7% |
| Immigrants | Uruguay | 34.1 /100 | #186 | Fair 13.7% |
| Slovaks | 34.1 /100 | #187 | Fair 13.7% |
| Immigrants | Eritrea | 32.7 /100 | #188 | Fair 13.7% |
| Finns | 32.5 /100 | #189 | Fair 13.7% |
| Dutch | 29.7 /100 | #190 | Fair 13.8% |
| Immigrants | St. Vincent and the Grenadines | 29.3 /100 | #191 | Fair 13.8% |
| Tlingit-Haida | 28.1 /100 | #192 | Fair 13.8% |
| Immigrants | Kenya | 28.0 /100 | #193 | Fair 13.8% |
| Moroccans | 25.1 /100 | #194 | Fair 13.8% |
| Immigrants | Cambodia | 24.0 /100 | #195 | Fair 13.9% |
| Scottish | 23.6 /100 | #196 | Fair 13.9% |
| Immigrants | Saudi Arabia | 21.9 /100 | #197 | Fair 13.9% |
| Immigrants | Germany | 20.9 /100 | #198 | Fair 13.9% |