Pueblo vs Immigrants from Pakistan Seniors Poverty Over the Age of 75
COMPARE
Pueblo
Immigrants from Pakistan
Seniors Poverty Over the Age of 75
Seniors Poverty Over the Age of 75 Comparison
Pueblo
Immigrants from Pakistan
16.7%
SENIORS POVERTY OVER THE AGE OF 75
0.0/ 100
METRIC RATING
326th/ 347
METRIC RANK
12.0%
SENIORS POVERTY OVER THE AGE OF 75
71.9/ 100
METRIC RATING
140th/ 347
METRIC RANK
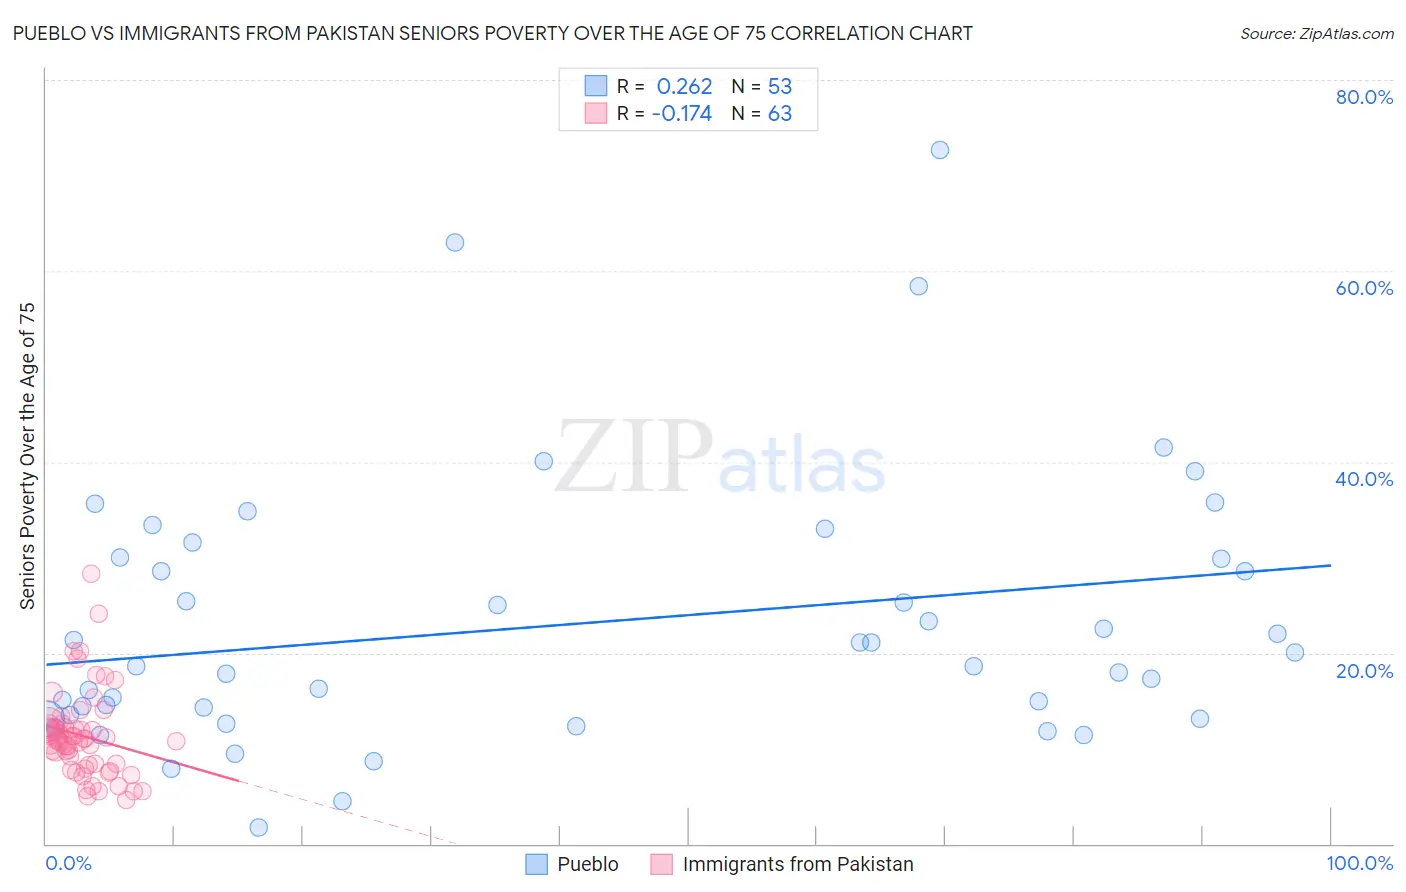
Pueblo vs Immigrants from Pakistan Seniors Poverty Over the Age of 75 Correlation Chart
The statistical analysis conducted on geographies consisting of 119,510,542 people shows a weak positive correlation between the proportion of Pueblo and poverty level among seniors over the age of 75 in the United States with a correlation coefficient (R) of 0.262 and weighted average of 16.7%. Similarly, the statistical analysis conducted on geographies consisting of 281,562,225 people shows a poor negative correlation between the proportion of Immigrants from Pakistan and poverty level among seniors over the age of 75 in the United States with a correlation coefficient (R) of -0.174 and weighted average of 12.0%, a difference of 39.9%.
Seniors Poverty Over the Age of 75 Correlation Summary
| Measurement | Pueblo | Immigrants from Pakistan |
| Minimum | 1.6% | 4.6% |
| Maximum | 72.7% | 28.2% |
| Range | 71.1% | 23.6% |
| Mean | 23.0% | 11.3% |
| Median | 18.6% | 10.8% |
| Interquartile 25% (IQ1) | 13.3% | 8.3% |
| Interquartile 75% (IQ3) | 29.9% | 12.3% |
| Interquartile Range (IQR) | 16.6% | 4.0% |
| Standard Deviation (Sample) | 14.0% | 4.5% |
| Standard Deviation (Population) | 13.9% | 4.5% |
Similar Demographics by Seniors Poverty Over the Age of 75
Demographics Similar to Pueblo by Seniors Poverty Over the Age of 75
In terms of seniors poverty over the age of 75, the demographic groups most similar to Pueblo are Sioux (16.8%, a difference of 0.21%), Cape Verdean (16.8%, a difference of 0.24%), Nicaraguan (16.6%, a difference of 0.70%), Immigrants from Uzbekistan (16.5%, a difference of 1.1%), and Central American Indian (16.5%, a difference of 1.1%).
| Demographics | Rating | Rank | Seniors Poverty Over the Age of 75 |
| Haitians | 0.0 /100 | #319 | Tragic 16.2% |
| Immigrants | Yemen | 0.0 /100 | #320 | Tragic 16.5% |
| Immigrants | Haiti | 0.0 /100 | #321 | Tragic 16.5% |
| Immigrants | Barbados | 0.0 /100 | #322 | Tragic 16.5% |
| Central American Indians | 0.0 /100 | #323 | Tragic 16.5% |
| Immigrants | Uzbekistan | 0.0 /100 | #324 | Tragic 16.5% |
| Nicaraguans | 0.0 /100 | #325 | Tragic 16.6% |
| Pueblo | 0.0 /100 | #326 | Tragic 16.7% |
| Sioux | 0.0 /100 | #327 | Tragic 16.8% |
| Cape Verdeans | 0.0 /100 | #328 | Tragic 16.8% |
| Immigrants | Dominica | 0.0 /100 | #329 | Tragic 17.0% |
| British West Indians | 0.0 /100 | #330 | Tragic 17.4% |
| Immigrants | Armenia | 0.0 /100 | #331 | Tragic 17.5% |
| Immigrants | St. Vincent and the Grenadines | 0.0 /100 | #332 | Tragic 17.5% |
| Immigrants | Nicaragua | 0.0 /100 | #333 | Tragic 17.6% |
Demographics Similar to Immigrants from Pakistan by Seniors Poverty Over the Age of 75
In terms of seniors poverty over the age of 75, the demographic groups most similar to Immigrants from Pakistan are Immigrants from Cameroon (12.0%, a difference of 0.020%), Immigrants from Laos (12.0%, a difference of 0.040%), Immigrants from Kenya (11.9%, a difference of 0.070%), Immigrants from Romania (11.9%, a difference of 0.080%), and American (12.0%, a difference of 0.090%).
| Demographics | Rating | Rank | Seniors Poverty Over the Age of 75 |
| Immigrants | Sierra Leone | 77.6 /100 | #133 | Good 11.9% |
| Ugandans | 77.1 /100 | #134 | Good 11.9% |
| Immigrants | Ireland | 76.2 /100 | #135 | Good 11.9% |
| Immigrants | Philippines | 75.0 /100 | #136 | Good 11.9% |
| Immigrants | Moldova | 74.1 /100 | #137 | Good 11.9% |
| Immigrants | Romania | 72.6 /100 | #138 | Good 11.9% |
| Immigrants | Kenya | 72.6 /100 | #139 | Good 11.9% |
| Immigrants | Pakistan | 71.9 /100 | #140 | Good 12.0% |
| Immigrants | Cameroon | 71.7 /100 | #141 | Good 12.0% |
| Immigrants | Laos | 71.5 /100 | #142 | Good 12.0% |
| Americans | 71.0 /100 | #143 | Good 12.0% |
| Hmong | 70.8 /100 | #144 | Good 12.0% |
| Immigrants | Belgium | 70.8 /100 | #145 | Good 12.0% |
| Bangladeshis | 70.4 /100 | #146 | Good 12.0% |
| Immigrants | Latvia | 69.1 /100 | #147 | Good 12.0% |