Portuguese vs Liberian Seniors Poverty Over the Age of 65
COMPARE
Portuguese
Liberian
Seniors Poverty Over the Age of 65
Seniors Poverty Over the Age of 65 Comparison
Portuguese
Liberians
10.5%
SENIORS POVERTY OVER THE AGE OF 65
84.1/ 100
METRIC RATING
139th/ 347
METRIC RANK
11.8%
SENIORS POVERTY OVER THE AGE OF 65
3.2/ 100
METRIC RATING
226th/ 347
METRIC RANK
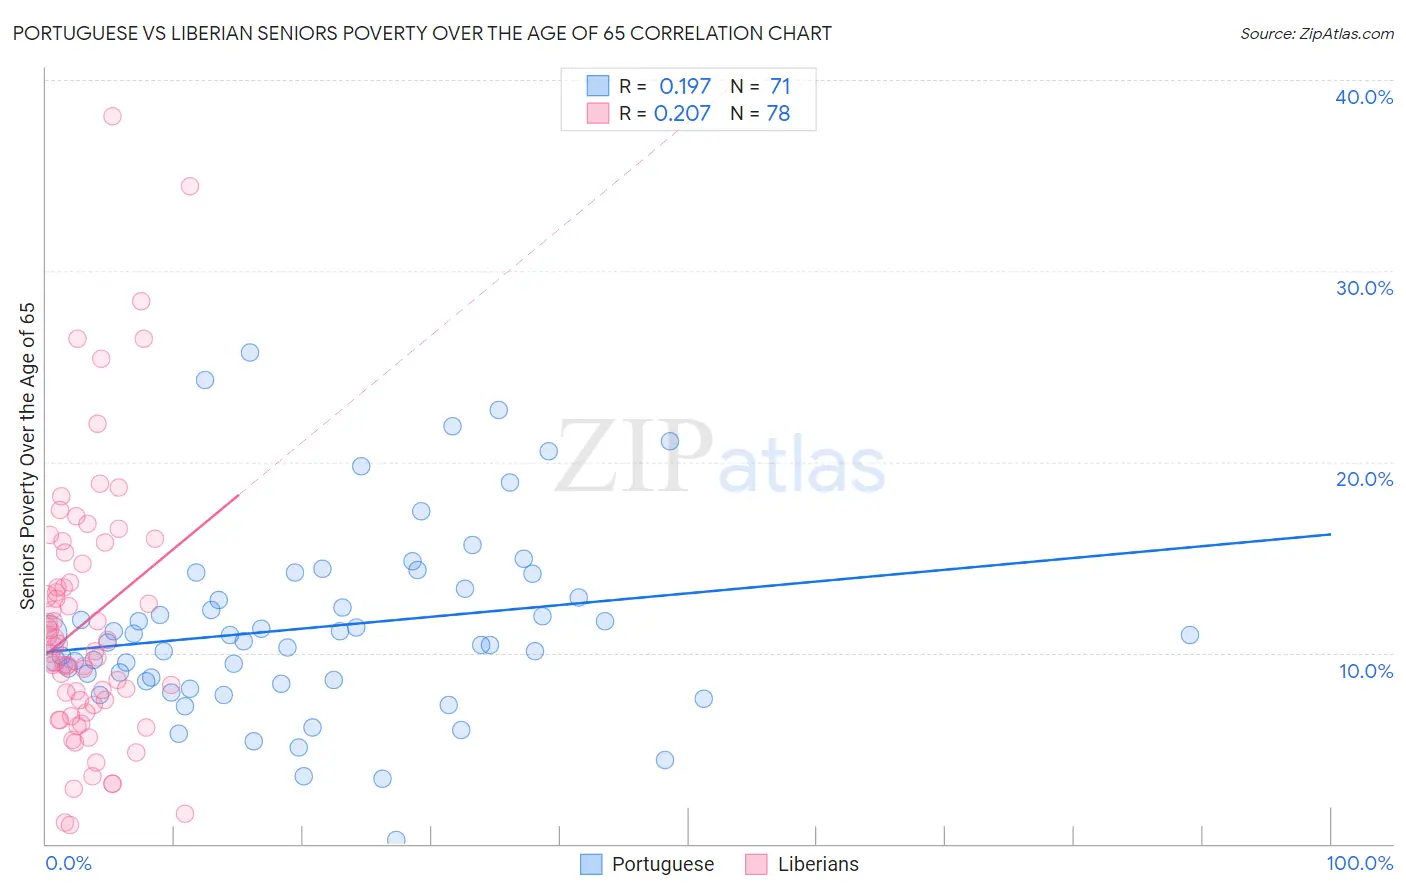
Portuguese vs Liberian Seniors Poverty Over the Age of 65 Correlation Chart
The statistical analysis conducted on geographies consisting of 447,984,891 people shows a poor positive correlation between the proportion of Portuguese and poverty level among seniors over the age of 65 in the United States with a correlation coefficient (R) of 0.197 and weighted average of 10.5%. Similarly, the statistical analysis conducted on geographies consisting of 117,906,609 people shows a weak positive correlation between the proportion of Liberians and poverty level among seniors over the age of 65 in the United States with a correlation coefficient (R) of 0.207 and weighted average of 11.8%, a difference of 11.7%.
Seniors Poverty Over the Age of 65 Correlation Summary
| Measurement | Portuguese | Liberian |
| Minimum | 0.21% | 0.95% |
| Maximum | 25.7% | 38.1% |
| Range | 25.5% | 37.1% |
| Mean | 11.3% | 11.6% |
| Median | 10.6% | 10.2% |
| Interquartile 25% (IQ1) | 8.5% | 7.3% |
| Interquartile 75% (IQ3) | 13.4% | 14.7% |
| Interquartile Range (IQR) | 4.8% | 7.4% |
| Standard Deviation (Sample) | 4.9% | 7.0% |
| Standard Deviation (Population) | 4.9% | 7.0% |
Similar Demographics by Seniors Poverty Over the Age of 65
Demographics Similar to Portuguese by Seniors Poverty Over the Age of 65
In terms of seniors poverty over the age of 65, the demographic groups most similar to Portuguese are Immigrants from Latvia (10.5%, a difference of 0.10%), Immigrants from Kenya (10.5%, a difference of 0.13%), Immigrants from Europe (10.5%, a difference of 0.15%), Immigrants from Australia (10.5%, a difference of 0.16%), and Osage (10.6%, a difference of 0.22%).
| Demographics | Rating | Rank | Seniors Poverty Over the Age of 65 |
| Immigrants | Turkey | 87.7 /100 | #132 | Excellent 10.5% |
| Guamanians/Chamorros | 87.5 /100 | #133 | Excellent 10.5% |
| Sierra Leoneans | 86.8 /100 | #134 | Excellent 10.5% |
| Immigrants | Norway | 86.5 /100 | #135 | Excellent 10.5% |
| Immigrants | Serbia | 86.4 /100 | #136 | Excellent 10.5% |
| Immigrants | Australia | 85.1 /100 | #137 | Excellent 10.5% |
| Immigrants | Latvia | 84.7 /100 | #138 | Excellent 10.5% |
| Portuguese | 84.1 /100 | #139 | Excellent 10.5% |
| Immigrants | Kenya | 83.4 /100 | #140 | Excellent 10.5% |
| Immigrants | Europe | 83.3 /100 | #141 | Excellent 10.5% |
| Osage | 82.8 /100 | #142 | Excellent 10.6% |
| Immigrants | Asia | 80.8 /100 | #143 | Excellent 10.6% |
| Iraqis | 80.7 /100 | #144 | Excellent 10.6% |
| Laotians | 79.9 /100 | #145 | Good 10.6% |
| Alaskan Athabascans | 79.1 /100 | #146 | Good 10.6% |
Demographics Similar to Liberians by Seniors Poverty Over the Age of 65
In terms of seniors poverty over the age of 65, the demographic groups most similar to Liberians are Immigrants from Belarus (11.8%, a difference of 0.020%), Nigerian (11.8%, a difference of 0.030%), Immigrants from Nigeria (11.7%, a difference of 0.12%), Immigrants from Congo (11.7%, a difference of 0.36%), and Immigrants from Costa Rica (11.8%, a difference of 0.36%).
| Demographics | Rating | Rank | Seniors Poverty Over the Age of 65 |
| Arapaho | 5.2 /100 | #219 | Tragic 11.6% |
| Peruvians | 4.2 /100 | #220 | Tragic 11.7% |
| Argentineans | 4.1 /100 | #221 | Tragic 11.7% |
| Immigrants | Chile | 3.9 /100 | #222 | Tragic 11.7% |
| Immigrants | Congo | 3.8 /100 | #223 | Tragic 11.7% |
| Immigrants | Nigeria | 3.4 /100 | #224 | Tragic 11.7% |
| Immigrants | Belarus | 3.2 /100 | #225 | Tragic 11.8% |
| Liberians | 3.2 /100 | #226 | Tragic 11.8% |
| Nigerians | 3.2 /100 | #227 | Tragic 11.8% |
| Immigrants | Costa Rica | 2.7 /100 | #228 | Tragic 11.8% |
| Immigrants | Eritrea | 2.6 /100 | #229 | Tragic 11.8% |
| Bermudans | 2.1 /100 | #230 | Tragic 11.9% |
| Cajuns | 2.0 /100 | #231 | Tragic 11.9% |
| Yaqui | 1.9 /100 | #232 | Tragic 11.9% |
| Panamanians | 1.8 /100 | #233 | Tragic 11.9% |