Dutch West Indian vs Liberian Seniors Poverty Over the Age of 65
COMPARE
Dutch West Indian
Liberian
Seniors Poverty Over the Age of 65
Seniors Poverty Over the Age of 65 Comparison
Dutch West Indians
Liberians
12.4%
SENIORS POVERTY OVER THE AGE OF 65
0.2/ 100
METRIC RATING
258th/ 347
METRIC RANK
11.8%
SENIORS POVERTY OVER THE AGE OF 65
3.2/ 100
METRIC RATING
226th/ 347
METRIC RANK
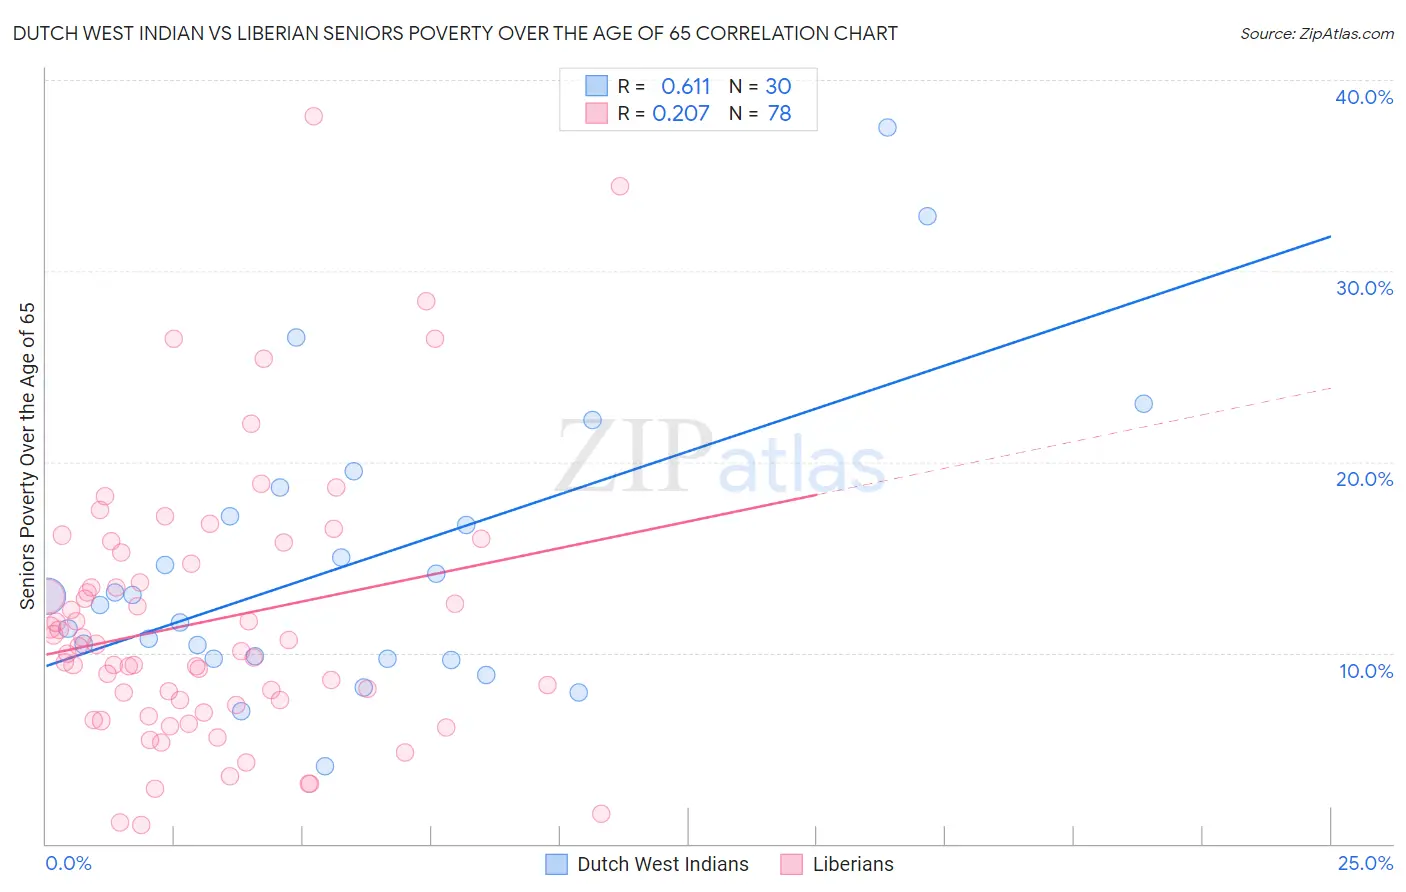
Dutch West Indian vs Liberian Seniors Poverty Over the Age of 65 Correlation Chart
The statistical analysis conducted on geographies consisting of 85,696,513 people shows a significant positive correlation between the proportion of Dutch West Indians and poverty level among seniors over the age of 65 in the United States with a correlation coefficient (R) of 0.611 and weighted average of 12.4%. Similarly, the statistical analysis conducted on geographies consisting of 117,906,609 people shows a weak positive correlation between the proportion of Liberians and poverty level among seniors over the age of 65 in the United States with a correlation coefficient (R) of 0.207 and weighted average of 11.8%, a difference of 5.8%.
Seniors Poverty Over the Age of 65 Correlation Summary
| Measurement | Dutch West Indian | Liberian |
| Minimum | 4.1% | 0.95% |
| Maximum | 37.5% | 38.1% |
| Range | 33.4% | 37.1% |
| Mean | 14.6% | 11.6% |
| Median | 12.7% | 10.2% |
| Interquartile 25% (IQ1) | 9.7% | 7.3% |
| Interquartile 75% (IQ3) | 17.2% | 14.7% |
| Interquartile Range (IQR) | 7.5% | 7.4% |
| Standard Deviation (Sample) | 7.5% | 7.0% |
| Standard Deviation (Population) | 7.4% | 7.0% |
Similar Demographics by Seniors Poverty Over the Age of 65
Demographics Similar to Dutch West Indians by Seniors Poverty Over the Age of 65
In terms of seniors poverty over the age of 65, the demographic groups most similar to Dutch West Indians are Ghanaian (12.4%, a difference of 0.030%), Immigrants from Panama (12.4%, a difference of 0.25%), Immigrants (12.4%, a difference of 0.25%), South American (12.5%, a difference of 0.27%), and Mexican American Indian (12.4%, a difference of 0.49%).
| Demographics | Rating | Rank | Seniors Poverty Over the Age of 65 |
| Somalis | 0.3 /100 | #251 | Tragic 12.3% |
| Armenians | 0.3 /100 | #252 | Tragic 12.3% |
| Shoshone | 0.3 /100 | #253 | Tragic 12.3% |
| Immigrants | Cambodia | 0.3 /100 | #254 | Tragic 12.4% |
| Mexican American Indians | 0.3 /100 | #255 | Tragic 12.4% |
| Immigrants | Panama | 0.2 /100 | #256 | Tragic 12.4% |
| Immigrants | Immigrants | 0.2 /100 | #257 | Tragic 12.4% |
| Dutch West Indians | 0.2 /100 | #258 | Tragic 12.4% |
| Ghanaians | 0.2 /100 | #259 | Tragic 12.4% |
| South Americans | 0.2 /100 | #260 | Tragic 12.5% |
| Colombians | 0.2 /100 | #261 | Tragic 12.5% |
| Venezuelans | 0.1 /100 | #262 | Tragic 12.5% |
| Soviet Union | 0.1 /100 | #263 | Tragic 12.6% |
| Inupiat | 0.1 /100 | #264 | Tragic 12.6% |
| Immigrants | Western Africa | 0.1 /100 | #265 | Tragic 12.6% |
Demographics Similar to Liberians by Seniors Poverty Over the Age of 65
In terms of seniors poverty over the age of 65, the demographic groups most similar to Liberians are Immigrants from Belarus (11.8%, a difference of 0.020%), Nigerian (11.8%, a difference of 0.030%), Immigrants from Nigeria (11.7%, a difference of 0.12%), Immigrants from Congo (11.7%, a difference of 0.36%), and Immigrants from Costa Rica (11.8%, a difference of 0.36%).
| Demographics | Rating | Rank | Seniors Poverty Over the Age of 65 |
| Arapaho | 5.2 /100 | #219 | Tragic 11.6% |
| Peruvians | 4.2 /100 | #220 | Tragic 11.7% |
| Argentineans | 4.1 /100 | #221 | Tragic 11.7% |
| Immigrants | Chile | 3.9 /100 | #222 | Tragic 11.7% |
| Immigrants | Congo | 3.8 /100 | #223 | Tragic 11.7% |
| Immigrants | Nigeria | 3.4 /100 | #224 | Tragic 11.7% |
| Immigrants | Belarus | 3.2 /100 | #225 | Tragic 11.8% |
| Liberians | 3.2 /100 | #226 | Tragic 11.8% |
| Nigerians | 3.2 /100 | #227 | Tragic 11.8% |
| Immigrants | Costa Rica | 2.7 /100 | #228 | Tragic 11.8% |
| Immigrants | Eritrea | 2.6 /100 | #229 | Tragic 11.8% |
| Bermudans | 2.1 /100 | #230 | Tragic 11.9% |
| Cajuns | 2.0 /100 | #231 | Tragic 11.9% |
| Yaqui | 1.9 /100 | #232 | Tragic 11.9% |
| Panamanians | 1.8 /100 | #233 | Tragic 11.9% |