Peruvian vs Basque Unemployment Among Seniors over 65 years
COMPARE
Peruvian
Basque
Unemployment Among Seniors over 65 years
Unemployment Among Seniors over 65 years Comparison
Peruvians
Basques
5.3%
UNEMPLOYMENT AMONG SENIORS OVER 65 YEARS
0.8/ 100
METRIC RATING
244th/ 347
METRIC RANK
5.1%
UNEMPLOYMENT AMONG SENIORS OVER 65 YEARS
72.9/ 100
METRIC RATING
155th/ 347
METRIC RANK
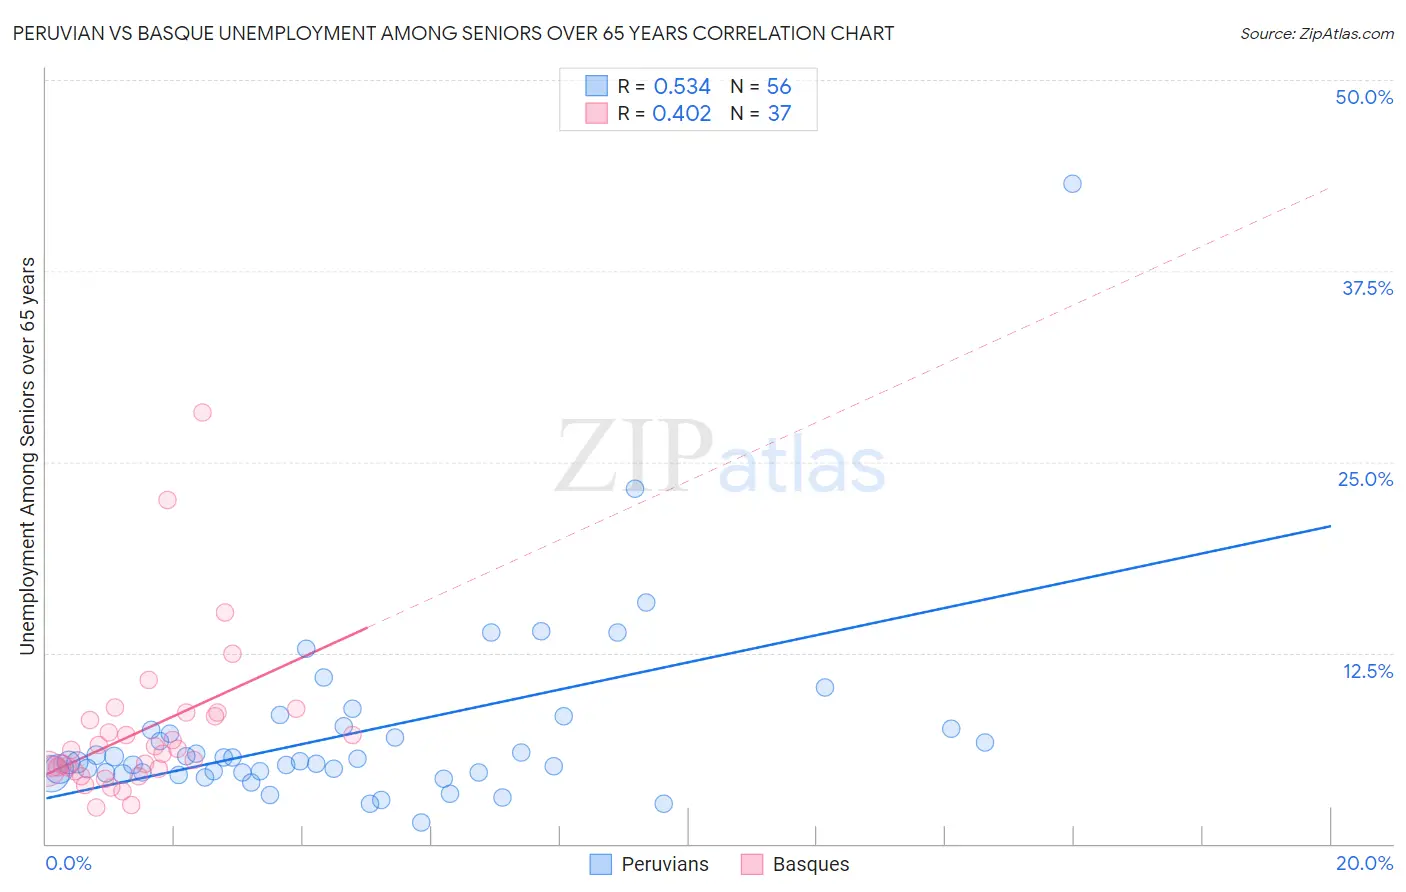
Peruvian vs Basque Unemployment Among Seniors over 65 years Correlation Chart
The statistical analysis conducted on geographies consisting of 333,726,313 people shows a substantial positive correlation between the proportion of Peruvians and unemployment rate amomg seniors over the age of 65 in the United States with a correlation coefficient (R) of 0.534 and weighted average of 5.3%. Similarly, the statistical analysis conducted on geographies consisting of 157,573,567 people shows a moderate positive correlation between the proportion of Basques and unemployment rate amomg seniors over the age of 65 in the United States with a correlation coefficient (R) of 0.402 and weighted average of 5.1%, a difference of 4.7%.
Unemployment Among Seniors over 65 years Correlation Summary
| Measurement | Peruvian | Basque |
| Minimum | 1.4% | 2.4% |
| Maximum | 43.2% | 28.2% |
| Range | 41.8% | 25.8% |
| Mean | 7.2% | 7.4% |
| Median | 5.4% | 6.1% |
| Interquartile 25% (IQ1) | 4.7% | 4.8% |
| Interquartile 75% (IQ3) | 7.5% | 8.5% |
| Interquartile Range (IQR) | 2.8% | 3.7% |
| Standard Deviation (Sample) | 6.2% | 5.1% |
| Standard Deviation (Population) | 6.1% | 5.0% |
Similar Demographics by Unemployment Among Seniors over 65 years
Demographics Similar to Peruvians by Unemployment Among Seniors over 65 years
In terms of unemployment among seniors over 65 years, the demographic groups most similar to Peruvians are Ottawa (5.3%, a difference of 0.010%), Colombian (5.3%, a difference of 0.040%), Immigrants from Caribbean (5.3%, a difference of 0.080%), Nigerian (5.3%, a difference of 0.10%), and Bahamian (5.3%, a difference of 0.13%).
| Demographics | Rating | Rank | Unemployment Among Seniors over 65 years |
| Immigrants | Greece | 2.0 /100 | #237 | Tragic 5.3% |
| Immigrants | Israel | 2.0 /100 | #238 | Tragic 5.3% |
| Immigrants | Senegal | 1.8 /100 | #239 | Tragic 5.3% |
| Immigrants | Trinidad and Tobago | 1.6 /100 | #240 | Tragic 5.3% |
| Apache | 1.3 /100 | #241 | Tragic 5.3% |
| Bahamians | 0.9 /100 | #242 | Tragic 5.3% |
| Nigerians | 0.9 /100 | #243 | Tragic 5.3% |
| Peruvians | 0.8 /100 | #244 | Tragic 5.3% |
| Ottawa | 0.8 /100 | #245 | Tragic 5.3% |
| Colombians | 0.7 /100 | #246 | Tragic 5.3% |
| Immigrants | Caribbean | 0.7 /100 | #247 | Tragic 5.3% |
| French Canadians | 0.7 /100 | #248 | Tragic 5.4% |
| Immigrants | Immigrants | 0.6 /100 | #249 | Tragic 5.4% |
| Ghanaians | 0.6 /100 | #250 | Tragic 5.4% |
| West Indians | 0.6 /100 | #251 | Tragic 5.4% |
Demographics Similar to Basques by Unemployment Among Seniors over 65 years
In terms of unemployment among seniors over 65 years, the demographic groups most similar to Basques are Immigrants from Romania (5.1%, a difference of 0.020%), Immigrants from Hong Kong (5.1%, a difference of 0.050%), Immigrants from Czechoslovakia (5.1%, a difference of 0.070%), Canadian (5.1%, a difference of 0.080%), and Immigrants from Asia (5.1%, a difference of 0.11%).
| Demographics | Rating | Rank | Unemployment Among Seniors over 65 years |
| Greeks | 77.0 /100 | #148 | Good 5.1% |
| Immigrants | Afghanistan | 76.8 /100 | #149 | Good 5.1% |
| Immigrants | Asia | 75.6 /100 | #150 | Good 5.1% |
| Pakistanis | 75.5 /100 | #151 | Good 5.1% |
| Canadians | 74.7 /100 | #152 | Good 5.1% |
| Immigrants | Czechoslovakia | 74.5 /100 | #153 | Good 5.1% |
| Immigrants | Hong Kong | 74.0 /100 | #154 | Good 5.1% |
| Basques | 72.9 /100 | #155 | Good 5.1% |
| Immigrants | Romania | 72.4 /100 | #156 | Good 5.1% |
| Immigrants | Northern Europe | 69.8 /100 | #157 | Good 5.1% |
| Immigrants | Belarus | 69.0 /100 | #158 | Good 5.1% |
| Immigrants | France | 68.6 /100 | #159 | Good 5.1% |
| French | 68.1 /100 | #160 | Good 5.1% |
| Immigrants | Bosnia and Herzegovina | 66.1 /100 | #161 | Good 5.1% |
| Immigrants | South Eastern Asia | 65.6 /100 | #162 | Good 5.1% |