Pennsylvania German vs Immigrants from Thailand Single Mother Poverty
COMPARE
Pennsylvania German
Immigrants from Thailand
Single Mother Poverty
Single Mother Poverty Comparison
Pennsylvania Germans
Immigrants from Thailand
33.2%
SINGLE MOTHER POVERTY
0.0/ 100
METRIC RATING
297th/ 347
METRIC RANK
29.9%
SINGLE MOTHER POVERTY
12.0/ 100
METRIC RATING
213th/ 347
METRIC RANK
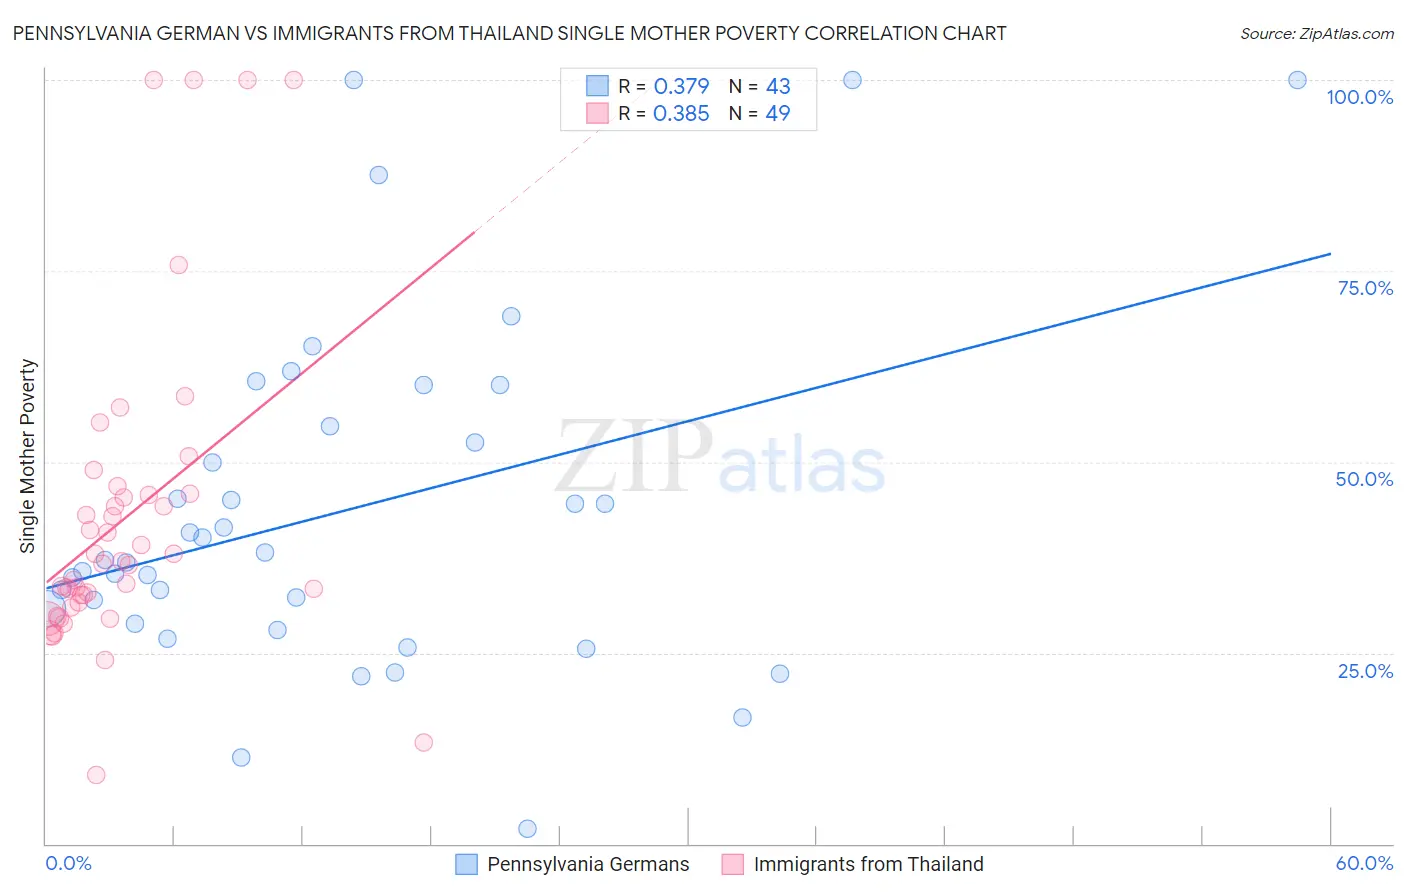
Pennsylvania German vs Immigrants from Thailand Single Mother Poverty Correlation Chart
The statistical analysis conducted on geographies consisting of 229,321,350 people shows a mild positive correlation between the proportion of Pennsylvania Germans and poverty level among single mothers in the United States with a correlation coefficient (R) of 0.379 and weighted average of 33.2%. Similarly, the statistical analysis conducted on geographies consisting of 311,723,568 people shows a mild positive correlation between the proportion of Immigrants from Thailand and poverty level among single mothers in the United States with a correlation coefficient (R) of 0.385 and weighted average of 29.9%, a difference of 11.3%.
Single Mother Poverty Correlation Summary
| Measurement | Pennsylvania German | Immigrants from Thailand |
| Minimum | 1.9% | 9.0% |
| Maximum | 100.0% | 100.0% |
| Range | 98.1% | 91.0% |
| Mean | 43.4% | 42.5% |
| Median | 37.2% | 36.7% |
| Interquartile 25% (IQ1) | 28.9% | 31.3% |
| Interquartile 75% (IQ3) | 54.6% | 45.8% |
| Interquartile Range (IQR) | 25.7% | 14.5% |
| Standard Deviation (Sample) | 22.5% | 20.5% |
| Standard Deviation (Population) | 22.3% | 20.3% |
Similar Demographics by Single Mother Poverty
Demographics Similar to Pennsylvania Germans by Single Mother Poverty
In terms of single mother poverty, the demographic groups most similar to Pennsylvania Germans are African (33.3%, a difference of 0.11%), Blackfeet (33.2%, a difference of 0.14%), Immigrants from Guatemala (33.3%, a difference of 0.20%), Hispanic or Latino (33.3%, a difference of 0.20%), and Yaqui (33.1%, a difference of 0.30%).
| Demographics | Rating | Rank | Single Mother Poverty |
| Osage | 0.0 /100 | #290 | Tragic 32.6% |
| Guatemalans | 0.0 /100 | #291 | Tragic 32.9% |
| Shoshone | 0.0 /100 | #292 | Tragic 32.9% |
| Aleuts | 0.0 /100 | #293 | Tragic 32.9% |
| French American Indians | 0.0 /100 | #294 | Tragic 33.1% |
| Yaqui | 0.0 /100 | #295 | Tragic 33.1% |
| Blackfeet | 0.0 /100 | #296 | Tragic 33.2% |
| Pennsylvania Germans | 0.0 /100 | #297 | Tragic 33.2% |
| Africans | 0.0 /100 | #298 | Tragic 33.3% |
| Immigrants | Guatemala | 0.0 /100 | #299 | Tragic 33.3% |
| Hispanics or Latinos | 0.0 /100 | #300 | Tragic 33.3% |
| Immigrants | Somalia | 0.0 /100 | #301 | Tragic 33.4% |
| Arapaho | 0.0 /100 | #302 | Tragic 33.4% |
| Americans | 0.0 /100 | #303 | Tragic 33.5% |
| Mexicans | 0.0 /100 | #304 | Tragic 33.6% |
Demographics Similar to Immigrants from Thailand by Single Mother Poverty
In terms of single mother poverty, the demographic groups most similar to Immigrants from Thailand are Liberian (29.9%, a difference of 0.030%), Jamaican (29.9%, a difference of 0.030%), Nicaraguan (29.8%, a difference of 0.050%), Immigrants from Western Africa (29.9%, a difference of 0.050%), and Immigrants from Ghana (29.9%, a difference of 0.080%).
| Demographics | Rating | Rank | Single Mother Poverty |
| Immigrants | Haiti | 15.8 /100 | #206 | Poor 29.7% |
| Immigrants | Panama | 15.5 /100 | #207 | Poor 29.8% |
| Immigrants | Guyana | 14.7 /100 | #208 | Poor 29.8% |
| Irish | 13.9 /100 | #209 | Poor 29.8% |
| Haitians | 13.3 /100 | #210 | Poor 29.8% |
| Guyanese | 12.8 /100 | #211 | Poor 29.8% |
| Nicaraguans | 12.4 /100 | #212 | Poor 29.8% |
| Immigrants | Thailand | 12.0 /100 | #213 | Poor 29.9% |
| Liberians | 11.7 /100 | #214 | Poor 29.9% |
| Jamaicans | 11.7 /100 | #215 | Poor 29.9% |
| Immigrants | Western Africa | 11.5 /100 | #216 | Poor 29.9% |
| Immigrants | Ghana | 11.3 /100 | #217 | Poor 29.9% |
| Hungarians | 10.3 /100 | #218 | Poor 29.9% |
| Finns | 9.3 /100 | #219 | Tragic 30.0% |
| Germans | 8.8 /100 | #220 | Tragic 30.0% |