Pennsylvania German vs Somali Female Poverty Among 25-34 Year Olds
COMPARE
Pennsylvania German
Somali
Female Poverty Among 25-34 Year Olds
Female Poverty Among 25-34 Year Olds Comparison
Pennsylvania Germans
Somalis
15.4%
FEMALE POVERTY AMONG 25-34 YEAR OLDS
0.1/ 100
METRIC RATING
264th/ 347
METRIC RANK
15.1%
FEMALE POVERTY AMONG 25-34 YEAR OLDS
0.4/ 100
METRIC RATING
254th/ 347
METRIC RANK
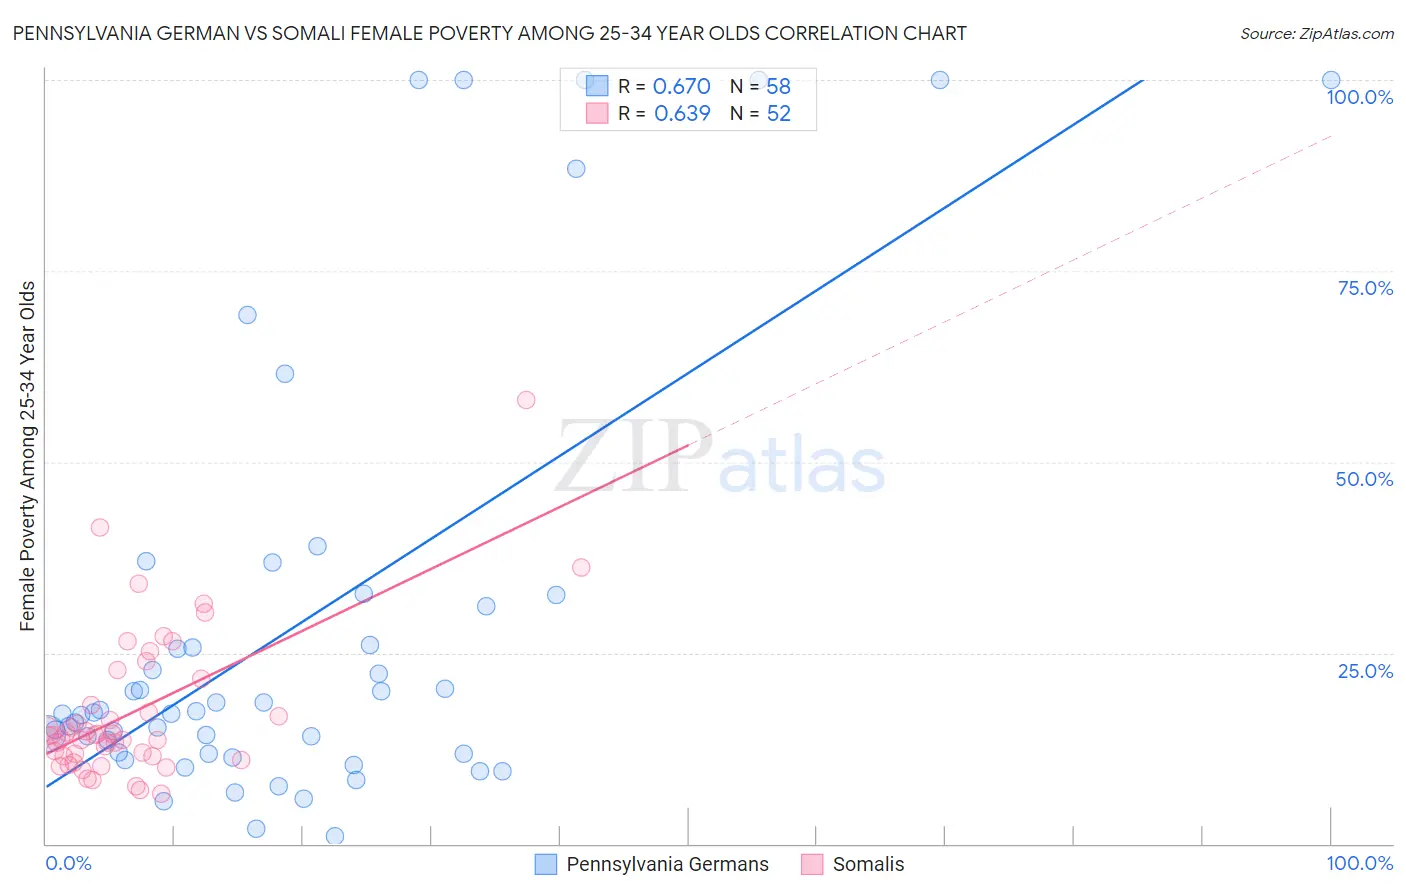
Pennsylvania German vs Somali Female Poverty Among 25-34 Year Olds Correlation Chart
The statistical analysis conducted on geographies consisting of 230,552,403 people shows a significant positive correlation between the proportion of Pennsylvania Germans and poverty level among females between the ages 25 and 34 in the United States with a correlation coefficient (R) of 0.670 and weighted average of 15.4%. Similarly, the statistical analysis conducted on geographies consisting of 98,871,118 people shows a significant positive correlation between the proportion of Somalis and poverty level among females between the ages 25 and 34 in the United States with a correlation coefficient (R) of 0.639 and weighted average of 15.1%, a difference of 2.2%.
Female Poverty Among 25-34 Year Olds Correlation Summary
| Measurement | Pennsylvania German | Somali |
| Minimum | 1.0% | 6.5% |
| Maximum | 100.0% | 58.1% |
| Range | 99.0% | 51.5% |
| Mean | 28.5% | 17.2% |
| Median | 17.1% | 14.2% |
| Interquartile 25% (IQ1) | 11.8% | 11.5% |
| Interquartile 75% (IQ3) | 31.1% | 19.9% |
| Interquartile Range (IQR) | 19.3% | 8.4% |
| Standard Deviation (Sample) | 28.8% | 9.7% |
| Standard Deviation (Population) | 28.5% | 9.7% |
Demographics Similar to Pennsylvania Germans and Somalis by Female Poverty Among 25-34 Year Olds
In terms of female poverty among 25-34 year olds, the demographic groups most similar to Pennsylvania Germans are Immigrants from Liberia (15.4%, a difference of 0.030%), Immigrants from Somalia (15.4%, a difference of 0.040%), Central American (15.5%, a difference of 0.42%), Mexican American Indian (15.4%, a difference of 0.43%), and Immigrants from Belize (15.3%, a difference of 0.68%). Similarly, the demographic groups most similar to Somalis are Immigrants from West Indies (15.1%, a difference of 0.080%), Belizean (15.1%, a difference of 0.22%), Haitian (15.0%, a difference of 0.39%), Immigrants from Laos (15.2%, a difference of 0.39%), and West Indian (15.2%, a difference of 0.55%).
| Demographics | Rating | Rank | Female Poverty Among 25-34 Year Olds |
| Immigrants | Haiti | 0.5 /100 | #249 | Tragic 15.0% |
| Immigrants | El Salvador | 0.5 /100 | #250 | Tragic 15.0% |
| Haitians | 0.5 /100 | #251 | Tragic 15.0% |
| Belizeans | 0.4 /100 | #252 | Tragic 15.1% |
| Immigrants | West Indies | 0.4 /100 | #253 | Tragic 15.1% |
| Somalis | 0.4 /100 | #254 | Tragic 15.1% |
| Immigrants | Laos | 0.3 /100 | #255 | Tragic 15.2% |
| West Indians | 0.3 /100 | #256 | Tragic 15.2% |
| Immigrants | Burma/Myanmar | 0.3 /100 | #257 | Tragic 15.2% |
| Nepalese | 0.2 /100 | #258 | Tragic 15.2% |
| Immigrants | Cuba | 0.2 /100 | #259 | Tragic 15.2% |
| Marshallese | 0.2 /100 | #260 | Tragic 15.3% |
| Liberians | 0.2 /100 | #261 | Tragic 15.3% |
| Immigrants | Belize | 0.2 /100 | #262 | Tragic 15.3% |
| Mexican American Indians | 0.2 /100 | #263 | Tragic 15.4% |
| Pennsylvania Germans | 0.1 /100 | #264 | Tragic 15.4% |
| Immigrants | Liberia | 0.1 /100 | #265 | Tragic 15.4% |
| Immigrants | Somalia | 0.1 /100 | #266 | Tragic 15.4% |
| Central Americans | 0.1 /100 | #267 | Tragic 15.5% |
| Immigrants | Senegal | 0.1 /100 | #268 | Tragic 15.6% |
| Sub-Saharan Africans | 0.1 /100 | #269 | Tragic 15.6% |