Osage vs Swedish Receiving Food Stamps
COMPARE
Osage
Swedish
Receiving Food Stamps
Receiving Food Stamps Comparison
Osage
Swedes
11.7%
RECEIVING FOOD STAMPS
49.8/ 100
METRIC RATING
175th/ 347
METRIC RANK
9.2%
RECEIVING FOOD STAMPS
99.8/ 100
METRIC RATING
26th/ 347
METRIC RANK
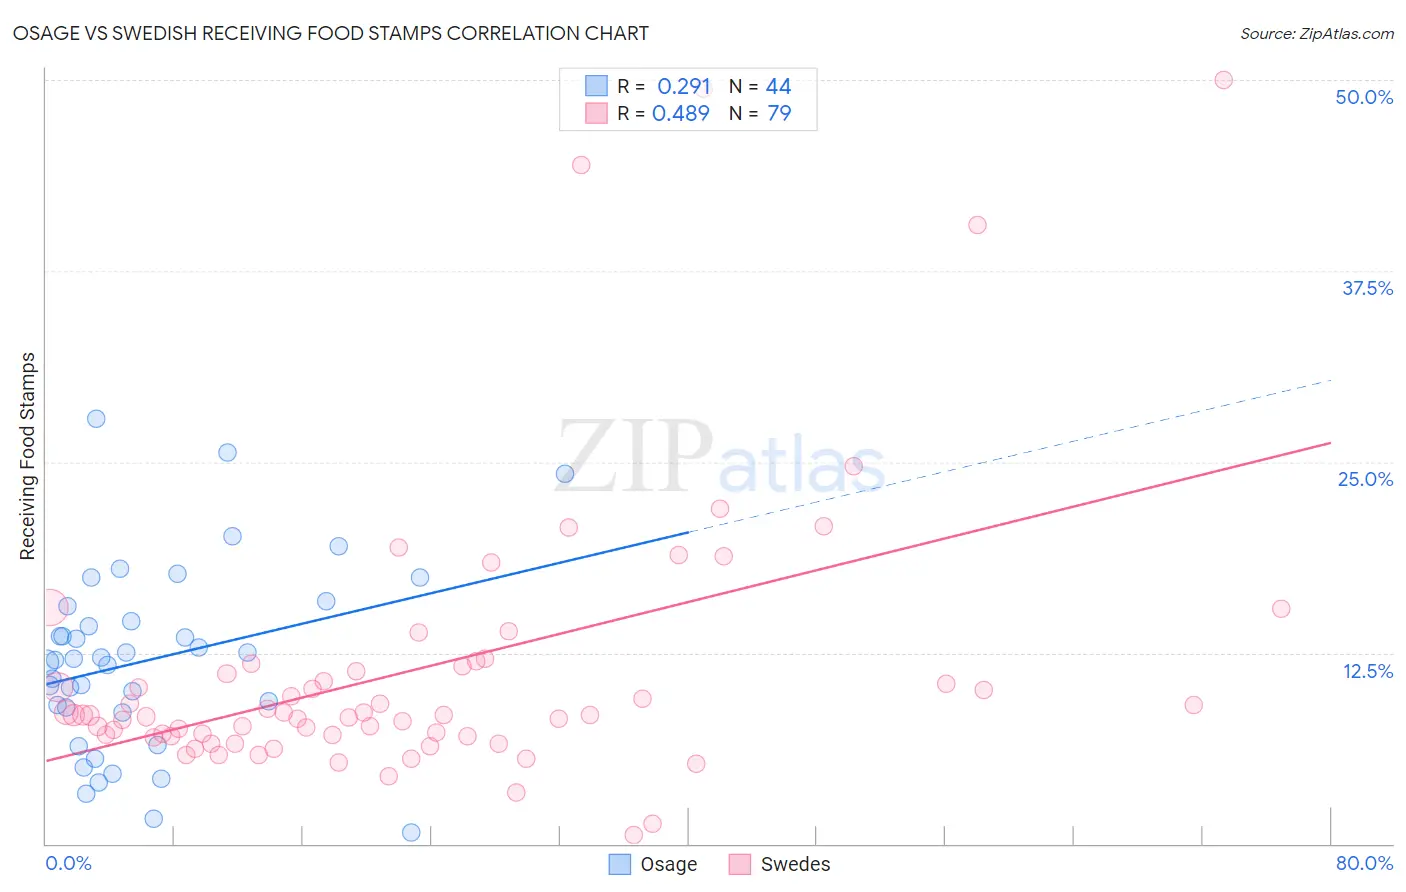
Osage vs Swedish Receiving Food Stamps Correlation Chart
The statistical analysis conducted on geographies consisting of 91,766,497 people shows a weak positive correlation between the proportion of Osage and percentage of population receiving government assistance and/or food stamps in the United States with a correlation coefficient (R) of 0.291 and weighted average of 11.7%. Similarly, the statistical analysis conducted on geographies consisting of 536,141,990 people shows a moderate positive correlation between the proportion of Swedes and percentage of population receiving government assistance and/or food stamps in the United States with a correlation coefficient (R) of 0.489 and weighted average of 9.2%, a difference of 27.7%.
Receiving Food Stamps Correlation Summary
| Measurement | Osage | Swedish |
| Minimum | 0.70% | 0.60% |
| Maximum | 27.8% | 50.0% |
| Range | 27.1% | 49.4% |
| Mean | 12.0% | 11.4% |
| Median | 12.1% | 8.4% |
| Interquartile 25% (IQ1) | 8.7% | 7.1% |
| Interquartile 75% (IQ3) | 15.0% | 11.6% |
| Interquartile Range (IQR) | 6.3% | 4.6% |
| Standard Deviation (Sample) | 6.1% | 9.3% |
| Standard Deviation (Population) | 6.0% | 9.2% |
Similar Demographics by Receiving Food Stamps
Demographics Similar to Osage by Receiving Food Stamps
In terms of receiving food stamps, the demographic groups most similar to Osage are Immigrants from Eritrea (11.7%, a difference of 0.020%), Peruvian (11.7%, a difference of 0.070%), Immigrants from Ukraine (11.8%, a difference of 0.21%), German Russian (11.8%, a difference of 0.24%), and Immigrants from Kenya (11.8%, a difference of 0.48%).
| Demographics | Rating | Rank | Receiving Food Stamps |
| Tlingit-Haida | 59.1 /100 | #168 | Average 11.6% |
| Immigrants | Eastern Africa | 58.3 /100 | #169 | Average 11.6% |
| Costa Ricans | 57.9 /100 | #170 | Average 11.6% |
| Immigrants | Western Asia | 56.4 /100 | #171 | Average 11.6% |
| Guamanians/Chamorros | 54.2 /100 | #172 | Average 11.7% |
| Immigrants | Syria | 53.4 /100 | #173 | Average 11.7% |
| Immigrants | Eritrea | 50.0 /100 | #174 | Average 11.7% |
| Osage | 49.8 /100 | #175 | Average 11.7% |
| Peruvians | 49.3 /100 | #176 | Average 11.7% |
| Immigrants | Ukraine | 48.4 /100 | #177 | Average 11.8% |
| German Russians | 48.1 /100 | #178 | Average 11.8% |
| Immigrants | Kenya | 46.4 /100 | #179 | Average 11.8% |
| Uruguayans | 44.8 /100 | #180 | Average 11.8% |
| South American Indians | 41.7 /100 | #181 | Average 11.9% |
| Immigrants | Morocco | 40.7 /100 | #182 | Average 11.9% |
Demographics Similar to Swedes by Receiving Food Stamps
In terms of receiving food stamps, the demographic groups most similar to Swedes are Immigrants from Ireland (9.2%, a difference of 0.20%), Bhutanese (9.2%, a difference of 0.24%), Czech (9.2%, a difference of 0.25%), Immigrants from Northern Europe (9.2%, a difference of 0.30%), and Eastern European (9.2%, a difference of 0.32%).
| Demographics | Rating | Rank | Receiving Food Stamps |
| Immigrants | Hong Kong | 99.8 /100 | #19 | Exceptional 9.1% |
| Latvians | 99.8 /100 | #20 | Exceptional 9.1% |
| Luxembourgers | 99.8 /100 | #21 | Exceptional 9.1% |
| Immigrants | Australia | 99.8 /100 | #22 | Exceptional 9.2% |
| Eastern Europeans | 99.8 /100 | #23 | Exceptional 9.2% |
| Immigrants | Northern Europe | 99.8 /100 | #24 | Exceptional 9.2% |
| Immigrants | Ireland | 99.8 /100 | #25 | Exceptional 9.2% |
| Swedes | 99.8 /100 | #26 | Exceptional 9.2% |
| Bhutanese | 99.8 /100 | #27 | Exceptional 9.2% |
| Czechs | 99.8 /100 | #28 | Exceptional 9.2% |
| Immigrants | Lithuania | 99.8 /100 | #29 | Exceptional 9.2% |
| Immigrants | Sweden | 99.7 /100 | #30 | Exceptional 9.3% |
| Immigrants | Eastern Asia | 99.7 /100 | #31 | Exceptional 9.3% |
| Bolivians | 99.7 /100 | #32 | Exceptional 9.3% |
| Zimbabweans | 99.6 /100 | #33 | Exceptional 9.5% |