Immigrants from South America vs Immigrants from Moldova Child Poverty Under the Age of 5
COMPARE
Immigrants from South America
Immigrants from Moldova
Child Poverty Under the Age of 5
Child Poverty Under the Age of 5 Comparison
Immigrants from South America
Immigrants from Moldova
17.1%
CHILD POVERTY UNDER THE AGE OF 5
60.0/ 100
METRIC RATING
169th/ 347
METRIC RANK
14.5%
CHILD POVERTY UNDER THE AGE OF 5
99.8/ 100
METRIC RATING
34th/ 347
METRIC RANK
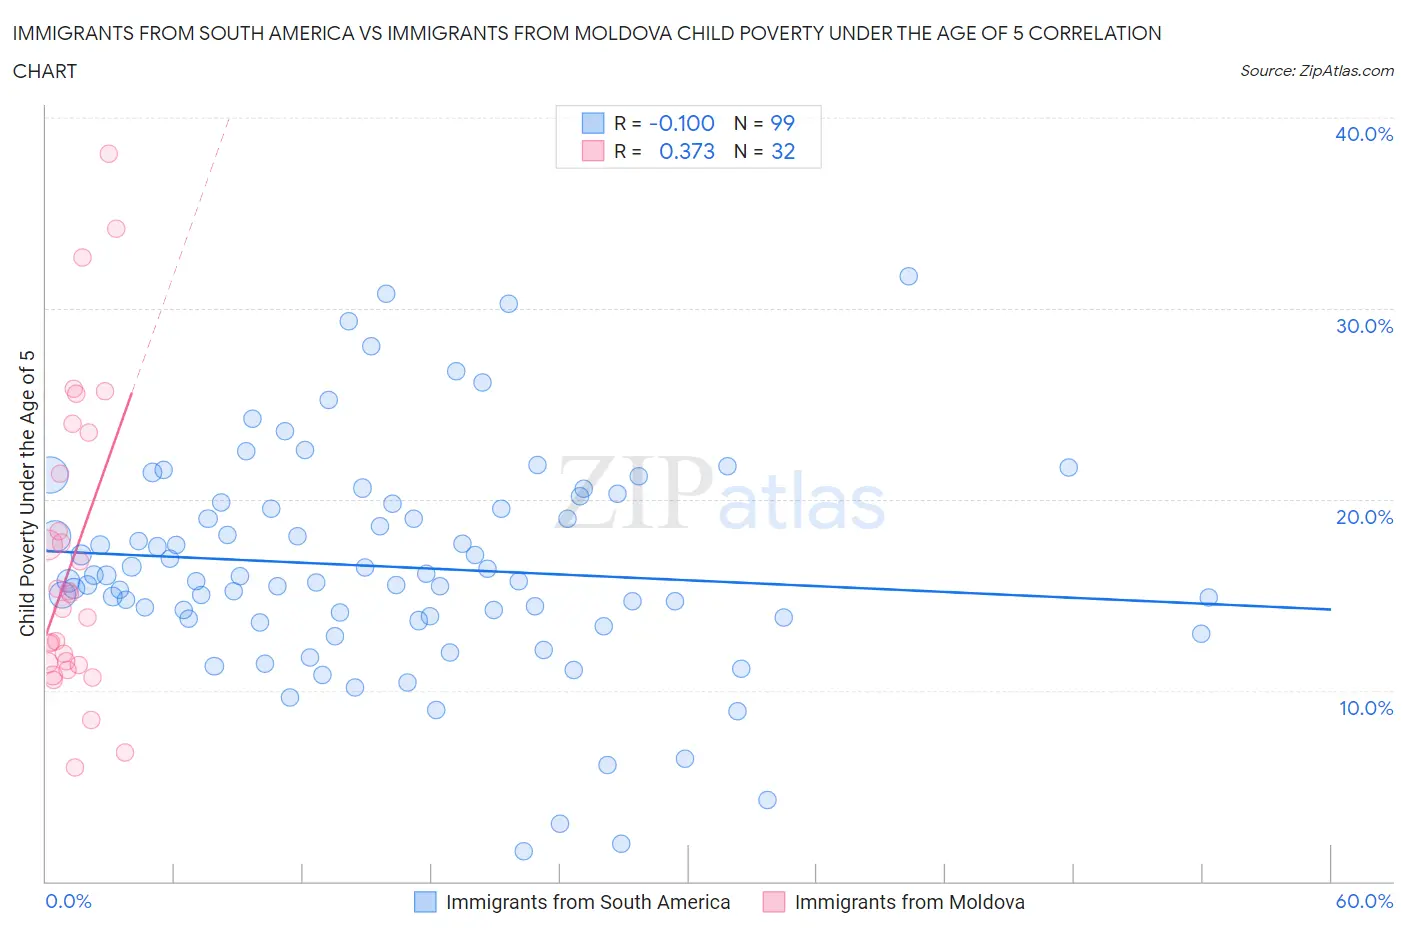
Immigrants from South America vs Immigrants from Moldova Child Poverty Under the Age of 5 Correlation Chart
The statistical analysis conducted on geographies consisting of 460,876,125 people shows a slight negative correlation between the proportion of Immigrants from South America and poverty level among children under the age of 5 in the United States with a correlation coefficient (R) of -0.100 and weighted average of 17.1%. Similarly, the statistical analysis conducted on geographies consisting of 121,099,285 people shows a mild positive correlation between the proportion of Immigrants from Moldova and poverty level among children under the age of 5 in the United States with a correlation coefficient (R) of 0.373 and weighted average of 14.5%, a difference of 17.6%.
Child Poverty Under the Age of 5 Correlation Summary
| Measurement | Immigrants from South America | Immigrants from Moldova |
| Minimum | 1.6% | 6.0% |
| Maximum | 31.7% | 38.1% |
| Range | 30.1% | 32.1% |
| Mean | 16.5% | 17.0% |
| Median | 15.7% | 14.7% |
| Interquartile 25% (IQ1) | 13.7% | 11.4% |
| Interquartile 75% (IQ3) | 19.8% | 22.4% |
| Interquartile Range (IQR) | 6.0% | 11.0% |
| Standard Deviation (Sample) | 5.8% | 8.0% |
| Standard Deviation (Population) | 5.7% | 7.9% |
Similar Demographics by Child Poverty Under the Age of 5
Demographics Similar to Immigrants from South America by Child Poverty Under the Age of 5
In terms of child poverty under the age of 5, the demographic groups most similar to Immigrants from South America are Uruguayan (17.0%, a difference of 0.050%), Immigrants from Western Asia (17.1%, a difference of 0.090%), Immigrants from Morocco (17.1%, a difference of 0.12%), Immigrants from Uzbekistan (17.0%, a difference of 0.21%), and Slavic (17.0%, a difference of 0.44%).
| Demographics | Rating | Rank | Child Poverty Under the Age of 5 |
| Costa Ricans | 69.8 /100 | #162 | Good 16.9% |
| Scottish | 68.6 /100 | #163 | Good 16.9% |
| Immigrants | Oceania | 67.6 /100 | #164 | Good 16.9% |
| Immigrants | Colombia | 66.9 /100 | #165 | Good 16.9% |
| Slavs | 64.0 /100 | #166 | Good 17.0% |
| Immigrants | Uzbekistan | 62.0 /100 | #167 | Good 17.0% |
| Uruguayans | 60.5 /100 | #168 | Good 17.0% |
| Immigrants | South America | 60.0 /100 | #169 | Good 17.1% |
| Immigrants | Western Asia | 59.2 /100 | #170 | Average 17.1% |
| Immigrants | Morocco | 58.9 /100 | #171 | Average 17.1% |
| Yugoslavians | 54.1 /100 | #172 | Average 17.2% |
| Welsh | 54.0 /100 | #173 | Average 17.2% |
| Immigrants | Saudi Arabia | 50.0 /100 | #174 | Average 17.2% |
| Immigrants | Lebanon | 47.6 /100 | #175 | Average 17.3% |
| Immigrants | Iraq | 45.2 /100 | #176 | Average 17.3% |
Demographics Similar to Immigrants from Moldova by Child Poverty Under the Age of 5
In terms of child poverty under the age of 5, the demographic groups most similar to Immigrants from Moldova are Latvian (14.5%, a difference of 0.010%), Maltese (14.5%, a difference of 0.080%), Taiwanese (14.5%, a difference of 0.10%), Immigrants from Sri Lanka (14.4%, a difference of 0.40%), and Turkish (14.6%, a difference of 0.42%).
| Demographics | Rating | Rank | Child Poverty Under the Age of 5 |
| Tongans | 99.9 /100 | #27 | Exceptional 14.2% |
| Immigrants | Indonesia | 99.8 /100 | #28 | Exceptional 14.3% |
| Immigrants | Asia | 99.8 /100 | #29 | Exceptional 14.4% |
| Cambodians | 99.8 /100 | #30 | Exceptional 14.4% |
| Koreans | 99.8 /100 | #31 | Exceptional 14.4% |
| Immigrants | Sri Lanka | 99.8 /100 | #32 | Exceptional 14.4% |
| Taiwanese | 99.8 /100 | #33 | Exceptional 14.5% |
| Immigrants | Moldova | 99.8 /100 | #34 | Exceptional 14.5% |
| Latvians | 99.8 /100 | #35 | Exceptional 14.5% |
| Maltese | 99.8 /100 | #36 | Exceptional 14.5% |
| Turks | 99.7 /100 | #37 | Exceptional 14.6% |
| Eastern Europeans | 99.7 /100 | #38 | Exceptional 14.6% |
| Norwegians | 99.7 /100 | #39 | Exceptional 14.6% |
| Immigrants | Australia | 99.7 /100 | #40 | Exceptional 14.6% |
| Immigrants | Belarus | 99.7 /100 | #41 | Exceptional 14.7% |