Mongolian vs Immigrants from Kenya Child Poverty Under the Age of 16
COMPARE
Mongolian
Immigrants from Kenya
Child Poverty Under the Age of 16
Child Poverty Under the Age of 16 Comparison
Mongolians
Immigrants from Kenya
15.2%
CHILD POVERTY UNDER THE AGE OF 16
89.5/ 100
METRIC RATING
130th/ 347
METRIC RANK
16.9%
CHILD POVERTY UNDER THE AGE OF 16
19.1/ 100
METRIC RATING
197th/ 347
METRIC RANK
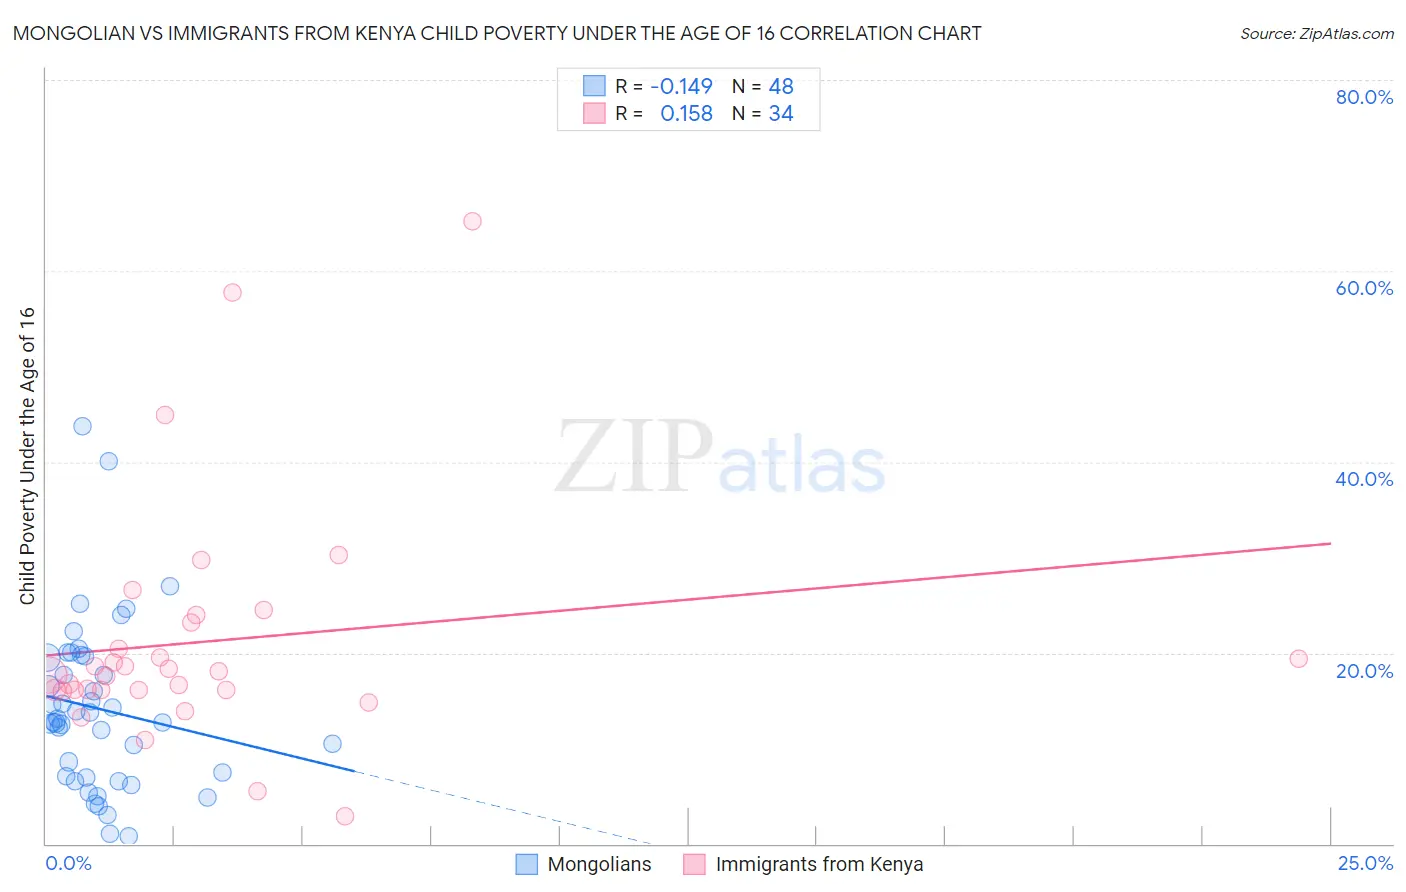
Mongolian vs Immigrants from Kenya Child Poverty Under the Age of 16 Correlation Chart
The statistical analysis conducted on geographies consisting of 140,038,106 people shows a poor negative correlation between the proportion of Mongolians and poverty level among children under the age of 16 in the United States with a correlation coefficient (R) of -0.149 and weighted average of 15.2%. Similarly, the statistical analysis conducted on geographies consisting of 217,344,865 people shows a poor positive correlation between the proportion of Immigrants from Kenya and poverty level among children under the age of 16 in the United States with a correlation coefficient (R) of 0.158 and weighted average of 16.9%, a difference of 11.5%.
Child Poverty Under the Age of 16 Correlation Summary
| Measurement | Mongolian | Immigrants from Kenya |
| Minimum | 0.81% | 2.8% |
| Maximum | 43.8% | 65.2% |
| Range | 43.0% | 62.4% |
| Mean | 14.1% | 21.2% |
| Median | 12.9% | 17.9% |
| Interquartile 25% (IQ1) | 7.0% | 16.1% |
| Interquartile 75% (IQ3) | 19.6% | 23.1% |
| Interquartile Range (IQR) | 12.5% | 7.1% |
| Standard Deviation (Sample) | 8.8% | 12.5% |
| Standard Deviation (Population) | 8.7% | 12.3% |
Similar Demographics by Child Poverty Under the Age of 16
Demographics Similar to Mongolians by Child Poverty Under the Age of 16
In terms of child poverty under the age of 16, the demographic groups most similar to Mongolians are Armenian (15.2%, a difference of 0.030%), Immigrants from Southern Europe (15.1%, a difference of 0.10%), Canadian (15.2%, a difference of 0.12%), Immigrants from South Eastern Asia (15.2%, a difference of 0.17%), and Immigrants from Kazakhstan (15.1%, a difference of 0.25%).
| Demographics | Rating | Rank | Child Poverty Under the Age of 16 |
| Immigrants | Brazil | 91.1 /100 | #123 | Exceptional 15.1% |
| Czechoslovakians | 91.0 /100 | #124 | Exceptional 15.1% |
| Palestinians | 90.9 /100 | #125 | Exceptional 15.1% |
| Portuguese | 90.6 /100 | #126 | Exceptional 15.1% |
| Immigrants | Western Europe | 90.3 /100 | #127 | Exceptional 15.1% |
| Immigrants | Kazakhstan | 90.2 /100 | #128 | Exceptional 15.1% |
| Immigrants | Southern Europe | 89.7 /100 | #129 | Excellent 15.1% |
| Mongolians | 89.5 /100 | #130 | Excellent 15.2% |
| Armenians | 89.4 /100 | #131 | Excellent 15.2% |
| Canadians | 89.1 /100 | #132 | Excellent 15.2% |
| Immigrants | South Eastern Asia | 89.0 /100 | #133 | Excellent 15.2% |
| Native Hawaiians | 88.7 /100 | #134 | Excellent 15.2% |
| Albanians | 88.6 /100 | #135 | Excellent 15.2% |
| Immigrants | Spain | 87.3 /100 | #136 | Excellent 15.3% |
| Peruvians | 87.2 /100 | #137 | Excellent 15.3% |
Demographics Similar to Immigrants from Kenya by Child Poverty Under the Age of 16
In terms of child poverty under the age of 16, the demographic groups most similar to Immigrants from Kenya are Delaware (17.0%, a difference of 0.40%), Immigrants from Lebanon (16.8%, a difference of 0.52%), Immigrants from Uganda (16.8%, a difference of 0.60%), Immigrants from Uruguay (16.8%, a difference of 0.69%), and Spaniard (16.8%, a difference of 0.71%).
| Demographics | Rating | Rank | Child Poverty Under the Age of 16 |
| Immigrants | Costa Rica | 29.6 /100 | #190 | Fair 16.6% |
| Immigrants | Iraq | 28.3 /100 | #191 | Fair 16.7% |
| Spanish | 24.5 /100 | #192 | Fair 16.7% |
| Spaniards | 23.2 /100 | #193 | Fair 16.8% |
| Immigrants | Uruguay | 23.1 /100 | #194 | Fair 16.8% |
| Immigrants | Uganda | 22.5 /100 | #195 | Fair 16.8% |
| Immigrants | Lebanon | 22.0 /100 | #196 | Fair 16.8% |
| Immigrants | Kenya | 19.1 /100 | #197 | Poor 16.9% |
| Delaware | 17.1 /100 | #198 | Poor 17.0% |
| Immigrants | Afghanistan | 15.1 /100 | #199 | Poor 17.0% |
| Immigrants | Cameroon | 14.7 /100 | #200 | Poor 17.1% |
| Immigrants | Uzbekistan | 14.7 /100 | #201 | Poor 17.1% |
| Ugandans | 14.3 /100 | #202 | Poor 17.1% |
| Immigrants | Sierra Leone | 14.2 /100 | #203 | Poor 17.1% |
| Hmong | 14.0 /100 | #204 | Poor 17.1% |