Mexican vs Immigrants from Africa Child Poverty Under the Age of 5
COMPARE
Mexican
Immigrants from Africa
Child Poverty Under the Age of 5
Child Poverty Under the Age of 5 Comparison
Mexicans
Immigrants from Africa
21.6%
CHILD POVERTY UNDER THE AGE OF 5
0.0/ 100
METRIC RATING
293rd/ 347
METRIC RANK
18.6%
CHILD POVERTY UNDER THE AGE OF 5
4.6/ 100
METRIC RATING
217th/ 347
METRIC RANK
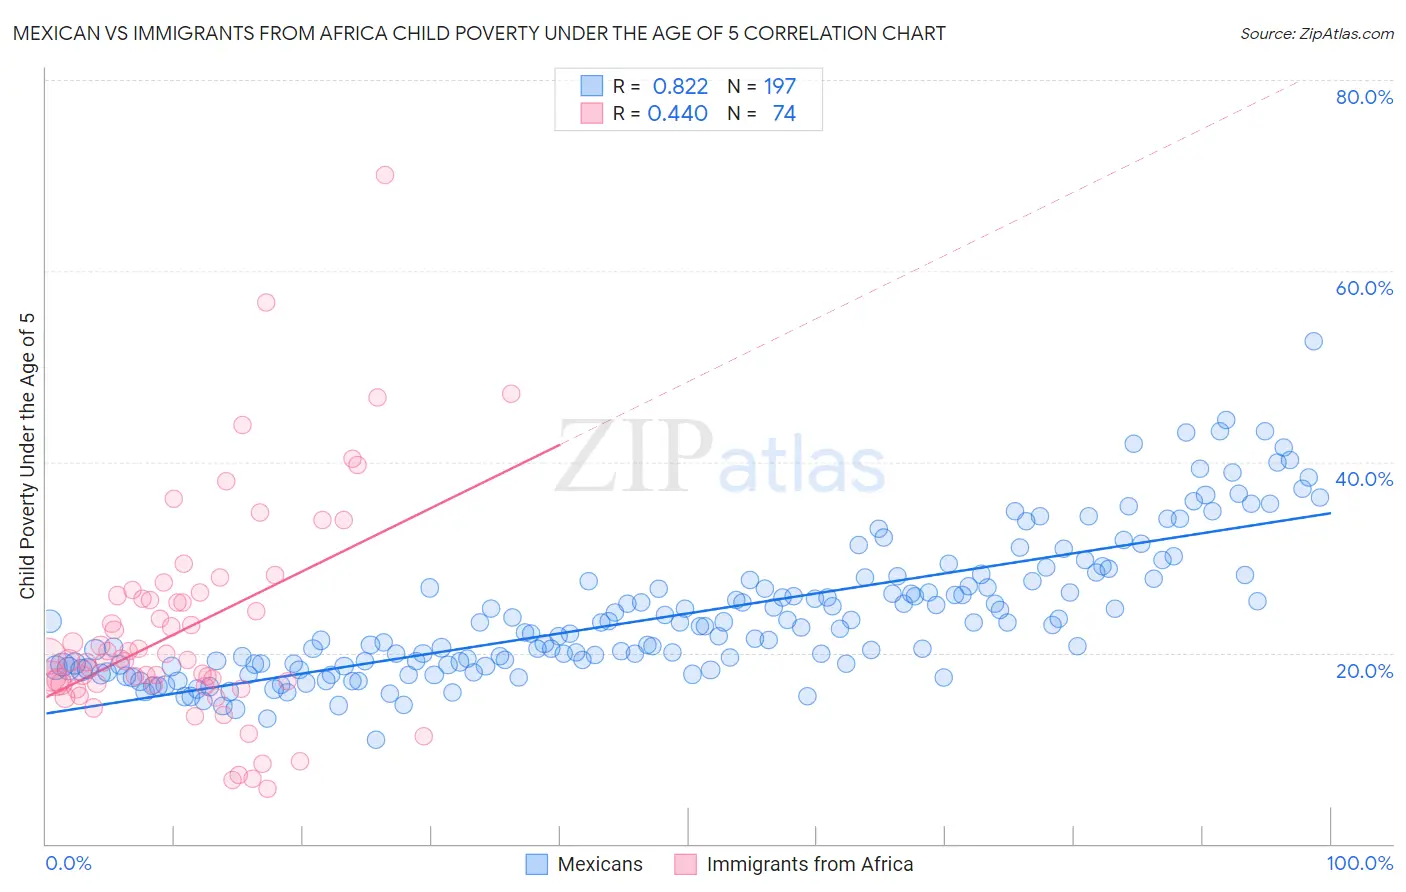
Mexican vs Immigrants from Africa Child Poverty Under the Age of 5 Correlation Chart
The statistical analysis conducted on geographies consisting of 529,273,492 people shows a very strong positive correlation between the proportion of Mexicans and poverty level among children under the age of 5 in the United States with a correlation coefficient (R) of 0.822 and weighted average of 21.6%. Similarly, the statistical analysis conducted on geographies consisting of 447,477,573 people shows a moderate positive correlation between the proportion of Immigrants from Africa and poverty level among children under the age of 5 in the United States with a correlation coefficient (R) of 0.440 and weighted average of 18.6%, a difference of 16.3%.
Child Poverty Under the Age of 5 Correlation Summary
| Measurement | Mexican | Immigrants from Africa |
| Minimum | 10.9% | 5.7% |
| Maximum | 52.6% | 70.0% |
| Range | 41.7% | 64.3% |
| Mean | 24.0% | 22.6% |
| Median | 22.6% | 19.3% |
| Interquartile 25% (IQ1) | 18.7% | 16.7% |
| Interquartile 75% (IQ3) | 27.5% | 26.0% |
| Interquartile Range (IQR) | 8.8% | 9.3% |
| Standard Deviation (Sample) | 7.3% | 11.3% |
| Standard Deviation (Population) | 7.3% | 11.3% |
Similar Demographics by Child Poverty Under the Age of 5
Demographics Similar to Mexicans by Child Poverty Under the Age of 5
In terms of child poverty under the age of 5, the demographic groups most similar to Mexicans are Guatemalan (21.6%, a difference of 0.14%), Immigrants from Somalia (21.6%, a difference of 0.28%), Cherokee (21.7%, a difference of 0.40%), Yaqui (21.7%, a difference of 0.55%), and Hispanic or Latino (21.7%, a difference of 0.57%).
| Demographics | Rating | Rank | Child Poverty Under the Age of 5 |
| Immigrants | Latin America | 0.0 /100 | #286 | Tragic 21.2% |
| Immigrants | Zaire | 0.0 /100 | #287 | Tragic 21.3% |
| Immigrants | Senegal | 0.0 /100 | #288 | Tragic 21.3% |
| Immigrants | Haiti | 0.0 /100 | #289 | Tragic 21.3% |
| Immigrants | Caribbean | 0.0 /100 | #290 | Tragic 21.4% |
| British West Indians | 0.0 /100 | #291 | Tragic 21.4% |
| Immigrants | Somalia | 0.0 /100 | #292 | Tragic 21.6% |
| Mexicans | 0.0 /100 | #293 | Tragic 21.6% |
| Guatemalans | 0.0 /100 | #294 | Tragic 21.6% |
| Cherokee | 0.0 /100 | #295 | Tragic 21.7% |
| Yaqui | 0.0 /100 | #296 | Tragic 21.7% |
| Hispanics or Latinos | 0.0 /100 | #297 | Tragic 21.7% |
| Blackfeet | 0.0 /100 | #298 | Tragic 21.8% |
| Chickasaw | 0.0 /100 | #299 | Tragic 21.8% |
| Alaskan Athabascans | 0.0 /100 | #300 | Tragic 21.8% |
Demographics Similar to Immigrants from Africa by Child Poverty Under the Age of 5
In terms of child poverty under the age of 5, the demographic groups most similar to Immigrants from Africa are Hmong (18.5%, a difference of 0.20%), Immigrants from Panama (18.5%, a difference of 0.66%), Delaware (18.7%, a difference of 0.75%), Malaysian (18.4%, a difference of 0.87%), and German Russian (18.8%, a difference of 1.1%).
| Demographics | Rating | Rank | Child Poverty Under the Age of 5 |
| Panamanians | 9.7 /100 | #210 | Tragic 18.2% |
| Moroccans | 9.4 /100 | #211 | Tragic 18.2% |
| Nepalese | 8.7 /100 | #212 | Tragic 18.3% |
| Immigrants | Thailand | 8.6 /100 | #213 | Tragic 18.3% |
| Malaysians | 6.5 /100 | #214 | Tragic 18.4% |
| Immigrants | Panama | 6.0 /100 | #215 | Tragic 18.5% |
| Hmong | 5.0 /100 | #216 | Tragic 18.5% |
| Immigrants | Africa | 4.6 /100 | #217 | Tragic 18.6% |
| Delaware | 3.4 /100 | #218 | Tragic 18.7% |
| German Russians | 3.0 /100 | #219 | Tragic 18.8% |
| Immigrants | Azores | 2.6 /100 | #220 | Tragic 18.9% |
| Immigrants | Nigeria | 2.1 /100 | #221 | Tragic 19.0% |
| Alsatians | 1.7 /100 | #222 | Tragic 19.1% |
| Cubans | 1.7 /100 | #223 | Tragic 19.1% |
| Nicaraguans | 1.6 /100 | #224 | Tragic 19.1% |