Immigrants from Iraq vs Immigrants from Africa Child Poverty Under the Age of 5

COMPARE

Immigrants from Iraq
Race
Ancestry
AfghanAfricanAlaska NativeAlaskan AthabascanAlbanianAleutAlsatianAmericanApacheArabArapahoArgentineanArmenianAssyrian/Chaldean/SyriacAustralianAustrianBahamianBangladeshiBarbadianBasqueBelgianBelizeanBermudanBhutaneseBlackfeetBolivianBrazilianBritishBritish West IndianBulgarianBurmeseCajunCambodianCanadianCape VerdeanCarpatho RusynCelticCentral AmericanCentral American IndianCherokeeCheyenneChickasawChileanChineseChippewaChoctawColombianColvilleComancheCosta RicanCreeCreekCroatianCrowCubanCypriotCzechCzechoslovakianDanishDelawareDominicanDutchDutch West IndianEastern EuropeanEcuadorianEgyptianEnglishEstonianEthiopianEuropeanFijianFilipinoFinnishFrenchFrench American IndianFrench CanadianGermanGerman RussianGhanaianGreekGuamanian/ChamorroGuatemalanGuyaneseHaitianHmongHonduranHopiHoumaHungarianIcelanderIndian (Asian)IndonesianInupiatIranianIraqiIrishIroquoisIsraeliItalianJamaicanJapaneseJordanianKenyanKiowaKoreanLaotianLatvianLebaneseLiberianLithuanianLumbeeLuxembourgerMacedonianMalaysianMalteseMarshalleseMenomineeMexicanMexican American IndianMongolianMoroccanNative HawaiianNavajoNepaleseNew ZealanderNicaraguanNigerianNorthern EuropeanNorwegianOkinawanOsageOttawaPaiutePakistaniPalestinianPanamanianParaguayanPennsylvania GermanPeruvianPimaPolishPortuguesePotawatomiPuebloPuerto RicanPuget Sound SalishRomanianRussianSalvadoranSamoanScandinavianScotch-IrishScottishSeminoleSenegaleseSerbianShoshoneSierra LeoneanSiouxSlavicSlovakSloveneSomaliSouth AfricanSouth AmericanSouth American IndianSoviet UnionSpaniardSpanishSpanish AmericanSpanish American IndianSri LankanSubsaharan AfricanSudaneseSwedishSwissSyrianTaiwaneseThaiTlingit-HaidaTohono O'OdhamTonganTrinidadian and TobagonianTsimshianTurkishU.S. Virgin IslanderUgandanUkrainianUruguayanUteVenezuelanVietnameseWelshWest IndianYakamaYaquiYugoslavianYumanYup'ikZimbabwean
Immigration
NonimmigrantsImmigrantsAfghanistanAlbaniaArgentinaArmeniaAsiaAustraliaAustriaBahamasBangladeshBarbadosBelarusBelgiumBelizeBoliviaBosnia and HerzegovinaBrazilBulgariaBurma/MyanmarCabo VerdeCambodiaCameroonCanadaCaribbeanCentral AmericaChileChinaColombiaCongoCosta RicaCroatiaCubaCzechoslovakiaDenmarkDominicaDominican RepublicEastern AfricaEastern AsiaEastern EuropeEcuadorEgyptEl SalvadorEnglandEritreaEthiopiaEuropeFijiFranceGermanyGhanaGreeceGrenadaGuatemalaGuyanaHaitiHondurasHong KongHungaryIndiaIndonesiaIranIraqIrelandIsraelItalyJamaicaJapanJordanKazakhstanKenyaKoreaKuwaitLaosLatin AmericaLatviaLebanonLiberiaLithuaniaMalaysiaMexicoMicronesiaMiddle AfricaMoldovaMoroccoNepalNetherlandsNicaraguaNigeriaNorth AmericaNorth MacedoniaNorthern AfricaNorthern EuropeNorwayOceaniaPakistanPanamaPeruPhilippinesPolandPortugalRomaniaRussiaSaudi ArabiaScotlandSenegalSerbiaSierra LeoneSingaporeSomaliaSouth AfricaSouth AmericaSouth Central AsiaSouth Eastern AsiaSouthern EuropeSpainSri LankaSt. Vincent and the GrenadinesSudanSwedenSwitzerlandSyriaTaiwanThailandTrinidad and TobagoTurkeyUgandaUkraineUruguayUzbekistanVenezuelaVietnamWest IndiesWestern AfricaWestern AsiaWestern EuropeYemenZaireZimbabweAzores
Immigrants from Africa
Race
Ancestry
AfghanAfricanAlaska NativeAlaskan AthabascanAlbanianAleutAlsatianAmericanApacheArabArapahoArgentineanArmenianAssyrian/Chaldean/SyriacAustralianAustrianBahamianBangladeshiBarbadianBasqueBelgianBelizeanBermudanBhutaneseBlackfeetBolivianBrazilianBritishBritish West IndianBulgarianBurmeseCajunCambodianCanadianCape VerdeanCarpatho RusynCelticCentral AmericanCentral American IndianCherokeeCheyenneChickasawChileanChineseChippewaChoctawColombianColvilleComancheCosta RicanCreeCreekCroatianCrowCubanCypriotCzechCzechoslovakianDanishDelawareDominicanDutchDutch West IndianEastern EuropeanEcuadorianEgyptianEnglishEstonianEthiopianEuropeanFijianFilipinoFinnishFrenchFrench American IndianFrench CanadianGermanGerman RussianGhanaianGreekGuamanian/ChamorroGuatemalanGuyaneseHaitianHmongHonduranHopiHoumaHungarianIcelanderIndian (Asian)IndonesianInupiatIranianIraqiIrishIroquoisIsraeliItalianJamaicanJapaneseJordanianKenyanKiowaKoreanLaotianLatvianLebaneseLiberianLithuanianLumbeeLuxembourgerMacedonianMalaysianMalteseMarshalleseMenomineeMexicanMexican American IndianMongolianMoroccanNative HawaiianNavajoNepaleseNew ZealanderNicaraguanNigerianNorthern EuropeanNorwegianOkinawanOsageOttawaPaiutePakistaniPalestinianPanamanianParaguayanPennsylvania GermanPeruvianPimaPolishPortuguesePotawatomiPuebloPuerto RicanPuget Sound SalishRomanianRussianSalvadoranSamoanScandinavianScotch-IrishScottishSeminoleSenegaleseSerbianShoshoneSierra LeoneanSiouxSlavicSlovakSloveneSomaliSouth AfricanSouth AmericanSouth American IndianSoviet UnionSpaniardSpanishSpanish AmericanSpanish American IndianSri LankanSubsaharan AfricanSudaneseSwedishSwissSyrianTaiwaneseThaiTlingit-HaidaTohono O'OdhamTonganTrinidadian and TobagonianTsimshianTurkishU.S. Virgin IslanderUgandanUkrainianUruguayanUteVenezuelanVietnameseWelshWest IndianYakamaYaquiYugoslavianYumanYup'ikZimbabwean
Immigration
NonimmigrantsImmigrantsAfghanistanAfricaAlbaniaArgentinaArmeniaAsiaAustraliaAustriaBahamasBangladeshBarbadosBelarusBelgiumBelizeBoliviaBosnia and HerzegovinaBrazilBulgariaBurma/MyanmarCabo VerdeCambodiaCameroonCanadaCaribbeanCentral AmericaChileChinaColombiaCongoCosta RicaCroatiaCubaCzechoslovakiaDenmarkDominicaDominican RepublicEastern AfricaEastern AsiaEastern EuropeEcuadorEgyptEl SalvadorEnglandEritreaEthiopiaEuropeFijiFranceGermanyGhanaGreeceGrenadaGuatemalaGuyanaHaitiHondurasHong KongHungaryIndiaIndonesiaIranIrelandIsraelItalyJamaicaJapanJordanKazakhstanKenyaKoreaKuwaitLaosLatin AmericaLatviaLebanonLiberiaLithuaniaMalaysiaMexicoMicronesiaMiddle AfricaMoldovaMoroccoNepalNetherlandsNicaraguaNigeriaNorth AmericaNorth MacedoniaNorthern AfricaNorthern EuropeNorwayOceaniaPakistanPanamaPeruPhilippinesPolandPortugalRomaniaRussiaSaudi ArabiaScotlandSenegalSerbiaSierra LeoneSingaporeSomaliaSouth AfricaSouth AmericaSouth Central AsiaSouth Eastern AsiaSouthern EuropeSpainSri LankaSt. Vincent and the GrenadinesSudanSwedenSwitzerlandSyriaTaiwanThailandTrinidad and TobagoTurkeyUgandaUkraineUruguayUzbekistanVenezuelaVietnamWest IndiesWestern AfricaWestern AsiaWestern EuropeYemenZaireZimbabweAzores
Child Poverty Under the Age of 5
Income
Poverty
Unemployment
Labor Participation
Family Structure
Vehicle Availability
Education Level
Disability

Child Poverty Under the Age of 5 Comparison

Immigrants from Iraq

Immigrants from Africa

Average
Tragic
17.3%
CHILD POVERTY UNDER THE AGE OF 5
45.2/ 100
METRIC RATING
176th/ 347
METRIC RANK
18.6%
CHILD POVERTY UNDER THE AGE OF 5
4.6/ 100
METRIC RATING
217th/ 347
METRIC RANK

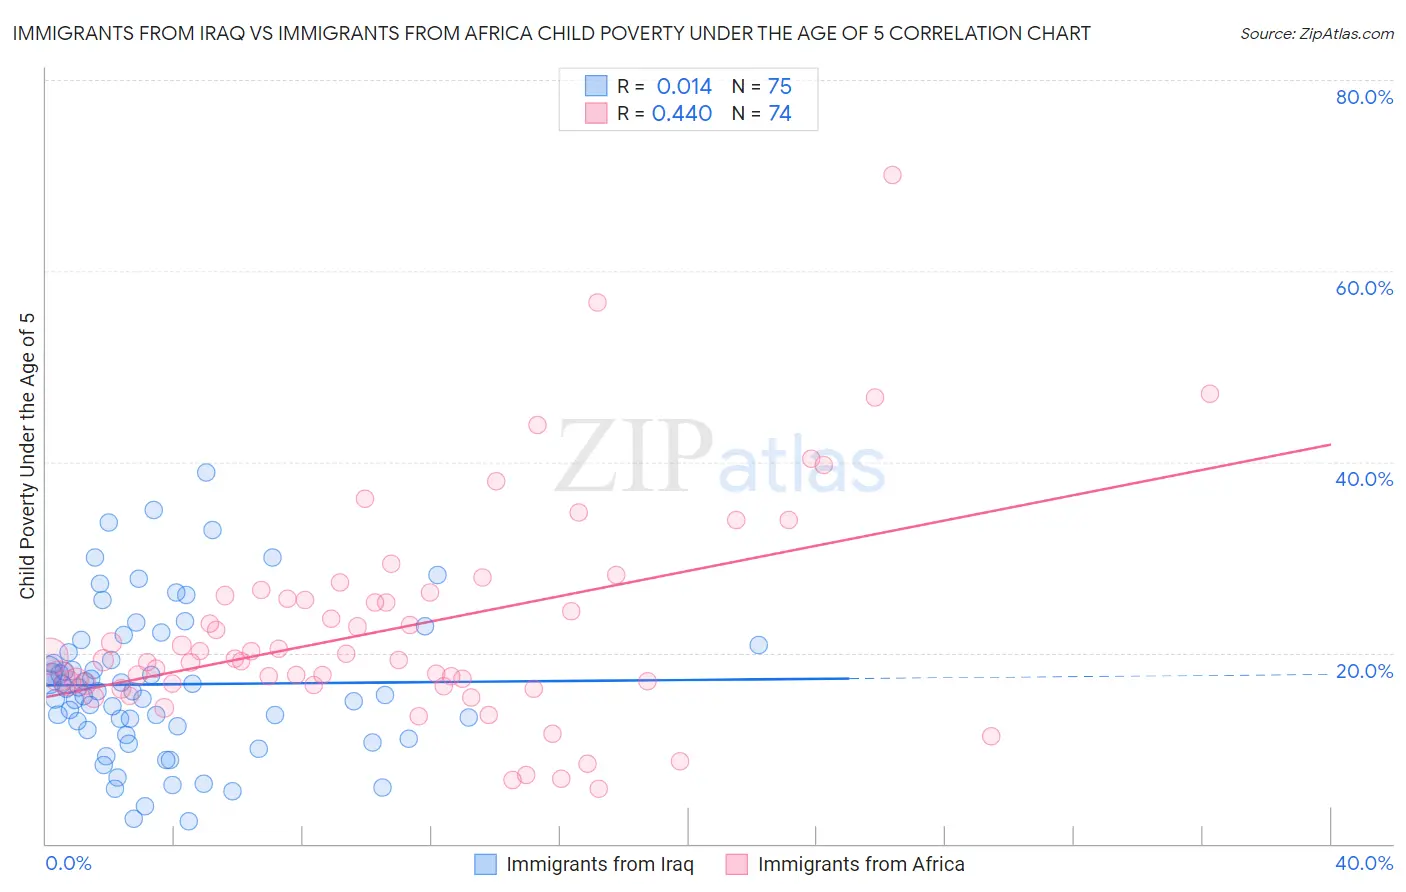
Immigrants from Iraq vs Immigrants from Africa Child Poverty Under the Age of 5 Correlation Chart

The statistical analysis conducted on geographies consisting of 190,454,654 people shows no correlation between the proportion of Immigrants from Iraq and poverty level among children under the age of 5 in the United States with a correlation coefficient (R) of 0.014 and weighted average of 17.3%. Similarly, the statistical analysis conducted on geographies consisting of 447,477,573 people shows a moderate positive correlation between the proportion of Immigrants from Africa and poverty level among children under the age of 5 in the United States with a correlation coefficient (R) of 0.440 and weighted average of 18.6%, a difference of 7.3%.
Immigrants from Iraq vs Immigrants from Africa Child Poverty Under the Age of 5

Child Poverty Under the Age of 5 Correlation Summary

MeasurementImmigrants from IraqImmigrants from Africa
Minimum2.4%5.7%
Maximum38.9%70.0%
Range36.5%64.3%
Mean16.7%22.6%
Median16.0%19.3%
Interquartile 25% (IQ1)11.9%16.7%
Interquartile 75% (IQ3)20.9%26.0%
Interquartile Range (IQR)9.0%9.3%
Standard Deviation (Sample)7.7%11.3%
Standard Deviation (Population)7.7%11.3%

Similar Demographics by Child Poverty Under the Age of 5

Demographics Similar to Immigrants from Iraq by Child Poverty Under the Age of 5

In terms of child poverty under the age of 5, the demographic groups most similar to Immigrants from Iraq are Immigrants from Sierra Leone (17.3%, a difference of 0.16%), Immigrants from Lebanon (17.3%, a difference of 0.25%), Immigrants from Cameroon (17.4%, a difference of 0.26%), Hawaiian (17.4%, a difference of 0.39%), and South American Indian (17.4%, a difference of 0.40%).
DemographicsRating | RankChild Poverty Under the Age of 5
Immigrants | South America
60.0
/100
|
#169
Good
17.1%
Immigrants | Western Asia
59.2
/100
|
#170
Average
17.1%
Immigrants | Morocco
58.9
/100
|
#171
Average
17.1%
Yugoslavians
54.1
/100
|
#172
Average
17.2%
Welsh
54.0
/100
|
#173
Average
17.2%
Immigrants | Saudi Arabia
50.0
/100
|
#174
Average
17.2%
Immigrants | Lebanon
47.6
/100
|
#175
Average
17.3%
Immigrants | Iraq
45.2
/100
|
#176
Average
17.3%
Immigrants | Sierra Leone
43.6
/100
|
#177
Average
17.3%
Immigrants | Cameroon
42.7
/100
|
#178
Average
17.4%
Hawaiians
41.5
/100
|
#179
Average
17.4%
South American Indians
41.4
/100
|
#180
Average
17.4%
Immigrants | Germany
41.0
/100
|
#181
Average
17.4%
Arabs
40.7
/100
|
#182
Average
17.4%
Lebanese
40.3
/100
|
#183
Average
17.4%

Demographics Similar to Immigrants from Africa by Child Poverty Under the Age of 5

In terms of child poverty under the age of 5, the demographic groups most similar to Immigrants from Africa are Hmong (18.5%, a difference of 0.20%), Immigrants from Panama (18.5%, a difference of 0.66%), Delaware (18.7%, a difference of 0.75%), Malaysian (18.4%, a difference of 0.87%), and German Russian (18.8%, a difference of 1.1%).
DemographicsRating | RankChild Poverty Under the Age of 5
Panamanians
9.7
/100
|
#210
Tragic
18.2%
Moroccans
9.4
/100
|
#211
Tragic
18.2%
Nepalese
8.7
/100
|
#212
Tragic
18.3%
Immigrants | Thailand
8.6
/100
|
#213
Tragic
18.3%
Malaysians
6.5
/100
|
#214
Tragic
18.4%
Immigrants | Panama
6.0
/100
|
#215
Tragic
18.5%
Hmong
5.0
/100
|
#216
Tragic
18.5%
Immigrants | Africa
4.6
/100
|
#217
Tragic
18.6%
Delaware
3.4
/100
|
#218
Tragic
18.7%
German Russians
3.0
/100
|
#219
Tragic
18.8%
Immigrants | Azores
2.6
/100
|
#220
Tragic
18.9%
Immigrants | Nigeria
2.1
/100
|
#221
Tragic
19.0%
Alsatians
1.7
/100
|
#222
Tragic
19.1%
Cubans
1.7
/100
|
#223
Tragic
19.1%
Nicaraguans
1.6
/100
|
#224
Tragic
19.1%