Mexican vs Asian Child Poverty Under the Age of 5
COMPARE
Mexican
Asian
Child Poverty Under the Age of 5
Child Poverty Under the Age of 5 Comparison
Mexicans
Asians
21.6%
CHILD POVERTY UNDER THE AGE OF 5
0.0/ 100
METRIC RATING
293rd/ 347
METRIC RANK
14.0%
CHILD POVERTY UNDER THE AGE OF 5
99.9/ 100
METRIC RATING
24th/ 347
METRIC RANK
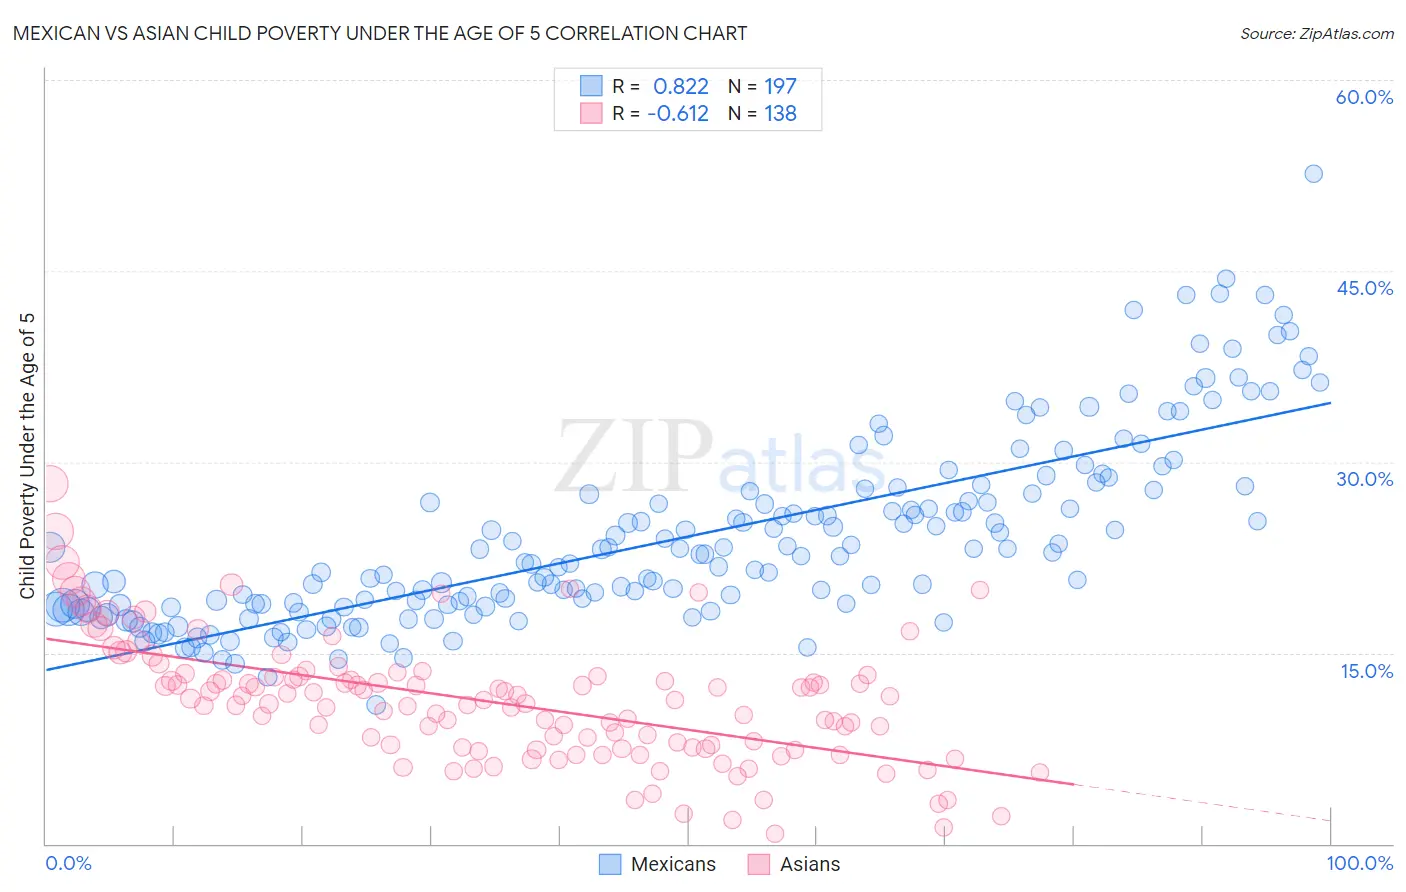
Mexican vs Asian Child Poverty Under the Age of 5 Correlation Chart
The statistical analysis conducted on geographies consisting of 529,273,492 people shows a very strong positive correlation between the proportion of Mexicans and poverty level among children under the age of 5 in the United States with a correlation coefficient (R) of 0.822 and weighted average of 21.6%. Similarly, the statistical analysis conducted on geographies consisting of 515,784,088 people shows a significant negative correlation between the proportion of Asians and poverty level among children under the age of 5 in the United States with a correlation coefficient (R) of -0.612 and weighted average of 14.0%, a difference of 54.8%.
Child Poverty Under the Age of 5 Correlation Summary
| Measurement | Mexican | Asian |
| Minimum | 10.9% | 0.77% |
| Maximum | 52.6% | 28.3% |
| Range | 41.7% | 27.5% |
| Mean | 24.0% | 11.1% |
| Median | 22.6% | 11.1% |
| Interquartile 25% (IQ1) | 18.7% | 7.6% |
| Interquartile 75% (IQ3) | 27.5% | 13.2% |
| Interquartile Range (IQR) | 8.8% | 5.6% |
| Standard Deviation (Sample) | 7.3% | 4.8% |
| Standard Deviation (Population) | 7.3% | 4.8% |
Similar Demographics by Child Poverty Under the Age of 5
Demographics Similar to Mexicans by Child Poverty Under the Age of 5
In terms of child poverty under the age of 5, the demographic groups most similar to Mexicans are Guatemalan (21.6%, a difference of 0.14%), Immigrants from Somalia (21.6%, a difference of 0.28%), Cherokee (21.7%, a difference of 0.40%), Yaqui (21.7%, a difference of 0.55%), and Hispanic or Latino (21.7%, a difference of 0.57%).
| Demographics | Rating | Rank | Child Poverty Under the Age of 5 |
| Immigrants | Latin America | 0.0 /100 | #286 | Tragic 21.2% |
| Immigrants | Zaire | 0.0 /100 | #287 | Tragic 21.3% |
| Immigrants | Senegal | 0.0 /100 | #288 | Tragic 21.3% |
| Immigrants | Haiti | 0.0 /100 | #289 | Tragic 21.3% |
| Immigrants | Caribbean | 0.0 /100 | #290 | Tragic 21.4% |
| British West Indians | 0.0 /100 | #291 | Tragic 21.4% |
| Immigrants | Somalia | 0.0 /100 | #292 | Tragic 21.6% |
| Mexicans | 0.0 /100 | #293 | Tragic 21.6% |
| Guatemalans | 0.0 /100 | #294 | Tragic 21.6% |
| Cherokee | 0.0 /100 | #295 | Tragic 21.7% |
| Yaqui | 0.0 /100 | #296 | Tragic 21.7% |
| Hispanics or Latinos | 0.0 /100 | #297 | Tragic 21.7% |
| Blackfeet | 0.0 /100 | #298 | Tragic 21.8% |
| Chickasaw | 0.0 /100 | #299 | Tragic 21.8% |
| Alaskan Athabascans | 0.0 /100 | #300 | Tragic 21.8% |
Demographics Similar to Asians by Child Poverty Under the Age of 5
In terms of child poverty under the age of 5, the demographic groups most similar to Asians are Cypriot (14.0%, a difference of 0.0%), Bulgarian (13.9%, a difference of 0.51%), Immigrants from Lithuania (14.1%, a difference of 0.93%), Immigrants from Bolivia (13.8%, a difference of 0.96%), and Bolivian (13.8%, a difference of 1.0%).
| Demographics | Rating | Rank | Child Poverty Under the Age of 5 |
| Assyrians/Chaldeans/Syriacs | 100.0 /100 | #17 | Exceptional 13.6% |
| Immigrants | China | 100.0 /100 | #18 | Exceptional 13.6% |
| Immigrants | Ireland | 100.0 /100 | #19 | Exceptional 13.7% |
| Immigrants | Japan | 100.0 /100 | #20 | Exceptional 13.8% |
| Bolivians | 100.0 /100 | #21 | Exceptional 13.8% |
| Immigrants | Bolivia | 100.0 /100 | #22 | Exceptional 13.8% |
| Bulgarians | 99.9 /100 | #23 | Exceptional 13.9% |
| Asians | 99.9 /100 | #24 | Exceptional 14.0% |
| Cypriots | 99.9 /100 | #25 | Exceptional 14.0% |
| Immigrants | Lithuania | 99.9 /100 | #26 | Exceptional 14.1% |
| Tongans | 99.9 /100 | #27 | Exceptional 14.2% |
| Immigrants | Indonesia | 99.8 /100 | #28 | Exceptional 14.3% |
| Immigrants | Asia | 99.8 /100 | #29 | Exceptional 14.4% |
| Cambodians | 99.8 /100 | #30 | Exceptional 14.4% |
| Koreans | 99.8 /100 | #31 | Exceptional 14.4% |