Immigrants from Liberia vs Immigrants from Moldova Single Father Poverty
COMPARE
Immigrants from Liberia
Immigrants from Moldova
Single Father Poverty
Single Father Poverty Comparison
Immigrants from Liberia
Immigrants from Moldova
15.9%
SINGLE FATHER POVERTY
91.1/ 100
METRIC RATING
127th/ 347
METRIC RANK
15.2%
SINGLE FATHER POVERTY
99.8/ 100
METRIC RATING
66th/ 347
METRIC RANK
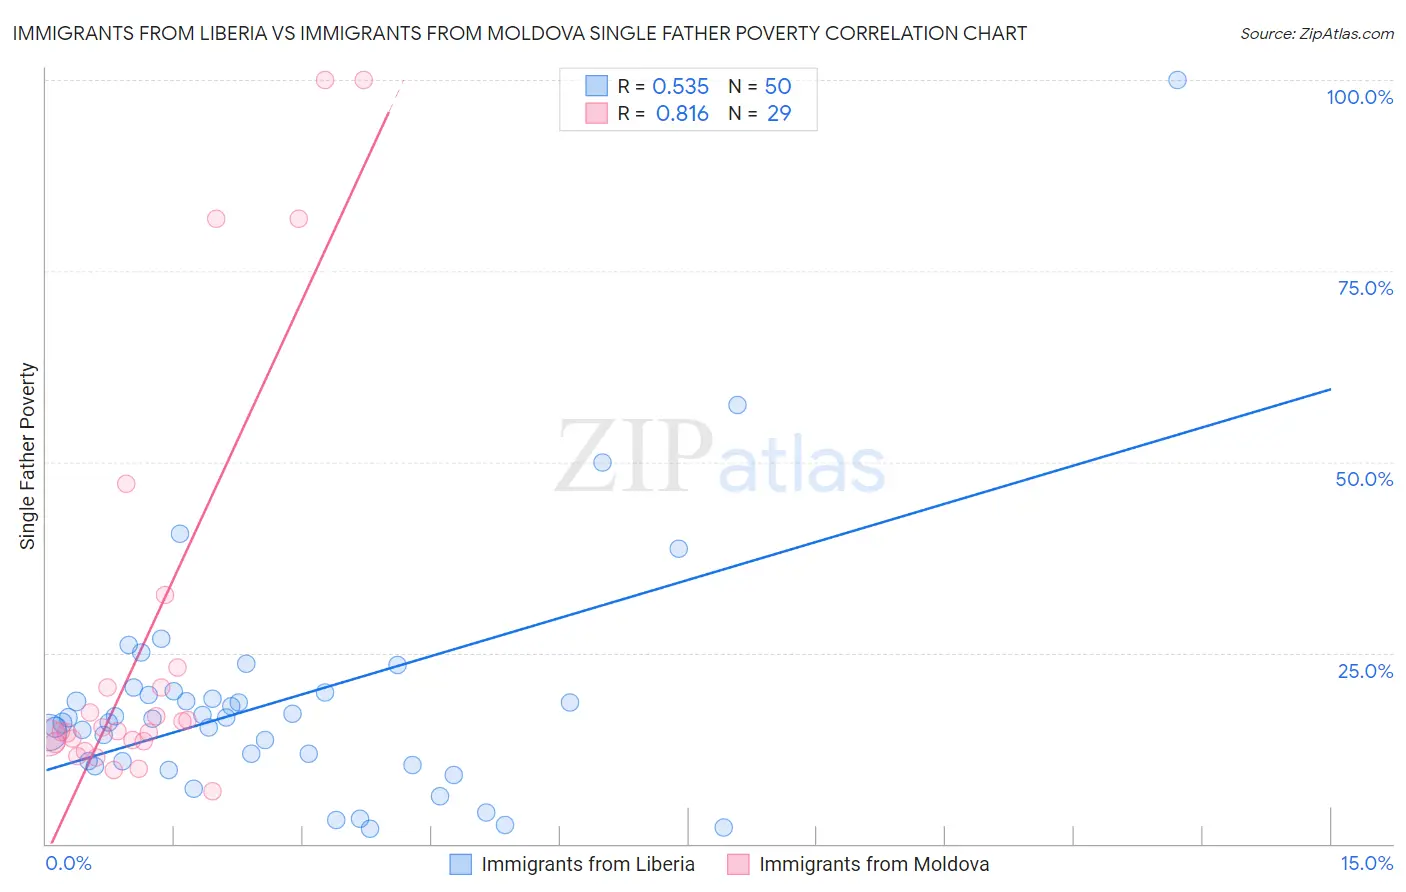
Immigrants from Liberia vs Immigrants from Moldova Single Father Poverty Correlation Chart
The statistical analysis conducted on geographies consisting of 122,784,105 people shows a substantial positive correlation between the proportion of Immigrants from Liberia and poverty level among single fathers in the United States with a correlation coefficient (R) of 0.535 and weighted average of 15.9%. Similarly, the statistical analysis conducted on geographies consisting of 107,585,694 people shows a very strong positive correlation between the proportion of Immigrants from Moldova and poverty level among single fathers in the United States with a correlation coefficient (R) of 0.816 and weighted average of 15.2%, a difference of 4.4%.
Single Father Poverty Correlation Summary
| Measurement | Immigrants from Liberia | Immigrants from Moldova |
| Minimum | 2.0% | 6.9% |
| Maximum | 100.0% | 100.0% |
| Range | 98.0% | 93.1% |
| Mean | 18.7% | 26.8% |
| Median | 16.5% | 14.7% |
| Interquartile 25% (IQ1) | 10.8% | 13.3% |
| Interquartile 75% (IQ3) | 19.8% | 21.8% |
| Interquartile Range (IQR) | 9.0% | 8.4% |
| Standard Deviation (Sample) | 16.1% | 27.4% |
| Standard Deviation (Population) | 15.9% | 26.9% |
Similar Demographics by Single Father Poverty
Demographics Similar to Immigrants from Liberia by Single Father Poverty
In terms of single father poverty, the demographic groups most similar to Immigrants from Liberia are Hmong (15.9%, a difference of 0.010%), Iraqi (15.9%, a difference of 0.020%), Immigrants from Panama (15.9%, a difference of 0.030%), Immigrants from Nigeria (15.9%, a difference of 0.030%), and Palestinian (15.9%, a difference of 0.040%).
| Demographics | Rating | Rank | Single Father Poverty |
| Uruguayans | 92.1 /100 | #120 | Exceptional 15.9% |
| Immigrants | Immigrants | 91.9 /100 | #121 | Exceptional 15.9% |
| Sudanese | 91.6 /100 | #122 | Exceptional 15.9% |
| Palestinians | 91.3 /100 | #123 | Exceptional 15.9% |
| Immigrants | Panama | 91.3 /100 | #124 | Exceptional 15.9% |
| Iraqis | 91.2 /100 | #125 | Exceptional 15.9% |
| Hmong | 91.1 /100 | #126 | Exceptional 15.9% |
| Immigrants | Liberia | 91.1 /100 | #127 | Exceptional 15.9% |
| Immigrants | Nigeria | 90.8 /100 | #128 | Exceptional 15.9% |
| Immigrants | West Indies | 90.8 /100 | #129 | Exceptional 15.9% |
| Norwegians | 90.2 /100 | #130 | Exceptional 15.9% |
| Nicaraguans | 90.1 /100 | #131 | Exceptional 15.9% |
| Immigrants | Portugal | 89.7 /100 | #132 | Excellent 15.9% |
| Immigrants | Syria | 89.5 /100 | #133 | Excellent 15.9% |
| Immigrants | South America | 88.5 /100 | #134 | Excellent 15.9% |
Demographics Similar to Immigrants from Moldova by Single Father Poverty
In terms of single father poverty, the demographic groups most similar to Immigrants from Moldova are Immigrants from Malaysia (15.2%, a difference of 0.020%), Paraguayan (15.2%, a difference of 0.090%), Bangladeshi (15.2%, a difference of 0.11%), Immigrants from Cameroon (15.2%, a difference of 0.18%), and Immigrants from Sweden (15.2%, a difference of 0.19%).
| Demographics | Rating | Rank | Single Father Poverty |
| Guamanians/Chamorros | 99.9 /100 | #59 | Exceptional 15.1% |
| Puget Sound Salish | 99.8 /100 | #60 | Exceptional 15.2% |
| Immigrants | Bosnia and Herzegovina | 99.8 /100 | #61 | Exceptional 15.2% |
| Immigrants | Armenia | 99.8 /100 | #62 | Exceptional 15.2% |
| Immigrants | Sweden | 99.8 /100 | #63 | Exceptional 15.2% |
| Bangladeshis | 99.8 /100 | #64 | Exceptional 15.2% |
| Immigrants | Malaysia | 99.8 /100 | #65 | Exceptional 15.2% |
| Immigrants | Moldova | 99.8 /100 | #66 | Exceptional 15.2% |
| Paraguayans | 99.7 /100 | #67 | Exceptional 15.2% |
| Immigrants | Cameroon | 99.7 /100 | #68 | Exceptional 15.2% |
| Japanese | 99.7 /100 | #69 | Exceptional 15.2% |
| Mongolians | 99.7 /100 | #70 | Exceptional 15.3% |
| Immigrants | Brazil | 99.6 /100 | #71 | Exceptional 15.3% |
| Immigrants | Lithuania | 99.6 /100 | #72 | Exceptional 15.3% |
| Kenyans | 99.6 /100 | #73 | Exceptional 15.3% |